This is one of the Flat Earth Academy's "you might find interesting" pages. There is nothing here you "ought" to know.
This page stems from and attempt to record temperatures and ambient light levels during a solar eclipse. But one thing led to another! There's more here than just that.
No expensive equipment was involved. All of the electronics and software are explained later. You could repeat the exercise.
The following graph was made from the data captured. The letters and dotted line are explained later.
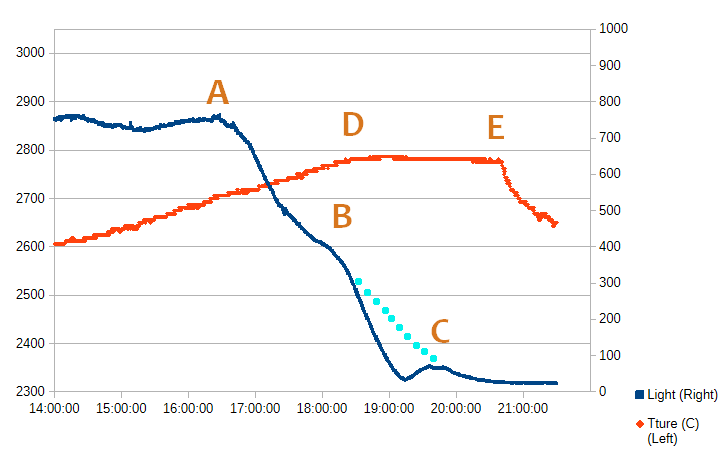
That's drawn from my real data. The results were not entirely as expected. Finding plausible explanations for what happened is one of the fun things about the exercise.
I've spent the hours it has taken to create this page in the hope that at least some readers will enjoy thinking "I could do that!" and "If I did it, I'd change what he did there." Etc!
Although this page is about the fun I had with the eclipse, there are things here that have broader implications. I hope thinking beyond what's "obvious" here will be fun for the reader.
There are several graphs and an animation on the screen. How would you go about making similar graphs, another animation? (I don't use expensive software or hardware (apart form my computer, but I have to have that for other things). Anyone can get results if they spend money. Can you get them without spending a lot of money?
These observations were made in southern England, from well south of London. The times in this are local times
The excellent https://www.timeanddate.com, told me that the eclipse of 12 August, 2026, would last from 18:18 to 20:07 where I was. (That will open in a new tab. Depending on your browser's settings, you may need to switch to it to see the TimeAndDate page. Just close that tab to get back to here.)
(timeanddate.com has an AMAZING treasure trove of information on times and dates.)
--------
It was in 2015 that I made my first attempt to record light levels and temperatures during an eclipse. Another eclipse came along again in 2025.
I was surprised but delighted to find that I was able to use the 2015 electronics for the 2025 and the 2026 eclipses with no more trouble than the trouble of plugging them in! (^_^) (We'll come to an error on my part in due course, but rectification would only have entailed re-siting the electronics.)
I'd unplugged the electronics shortly after the 2015 eclipse. But I hadn't moved it.
I had improved the relevant software... it was not specific to the solar eclipse recording... but wonderfully (if somewhat unexpectedly) old electronics and the extended software again worked well, with little struggle, in 2025! (That was just as well because I learned of the 2025 eclipse three hours before it began.)
In 2026, I set things up in a more timely manner, and again little "setup" was needed. The electronics were still sitting neglected in a dusty corner. They worked first time, when plugged in after a year.
A small tweak to the software's configuration made things go more smoothly for the 2026 eclipse. (In 2025, the data had been parsed incorrectly, and re-parsing it was an unwelcome... but do-able... nuisance. (More on this later.)
=== Weather
In 2015, there were clouds on the day.... but from the data, it seemed that the cloud cover was helpfully consistent. In 2025 the weather was much better... it was a nearly cloudless day.
In 2026 the conditions were glorious. The sky was nearly cloudless, all day. The eclipse was in the late afternoon, but finished before sunset began.
(Good conditions for the eclipse. But weeks of that weather had left the country in dire straits.)
Even without the eclipse, spending that beautiful summer's evening where I was to photograph it would have been wonderful. I was at Halnaker Mill https://w3w.co/drivers.future.giraffes. The link will open a zoomable map.
We'll come to more technical matters in a moment, but first...
Even at the "darkest" period, the day was not what I'd call dark. However, the light was very clearly "different", and the temperature seemed lower.
At mid-eclipse the light was less bright, and seemed more yellow... a bit like the light you sometimes get during the early stages of a sunset... except the sun was still high in the sky! (There was a glorious sunset not long after the eclipse. But the former was over well before the latter began.)
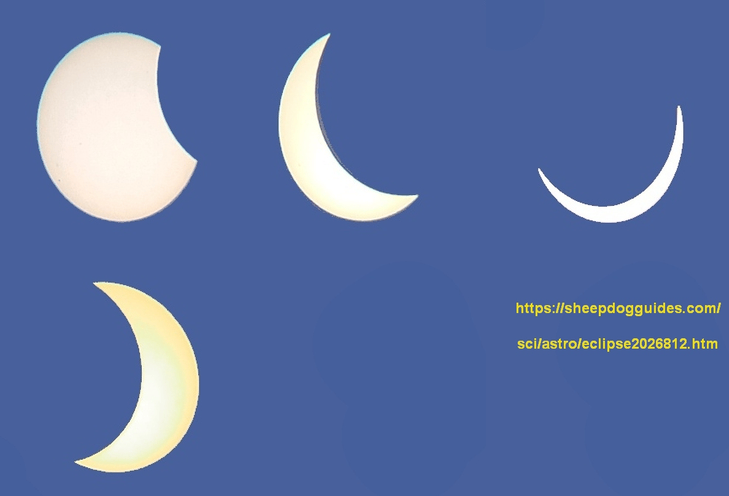
My heartfelt thanks go to https://ezgif.com/maker for the excellent, user-friendly, free, web-based .gig maker that created the animation. The crescents are taken from the photographs I've shown in the montage. The backgrounds were simplified to make the animation nicer.
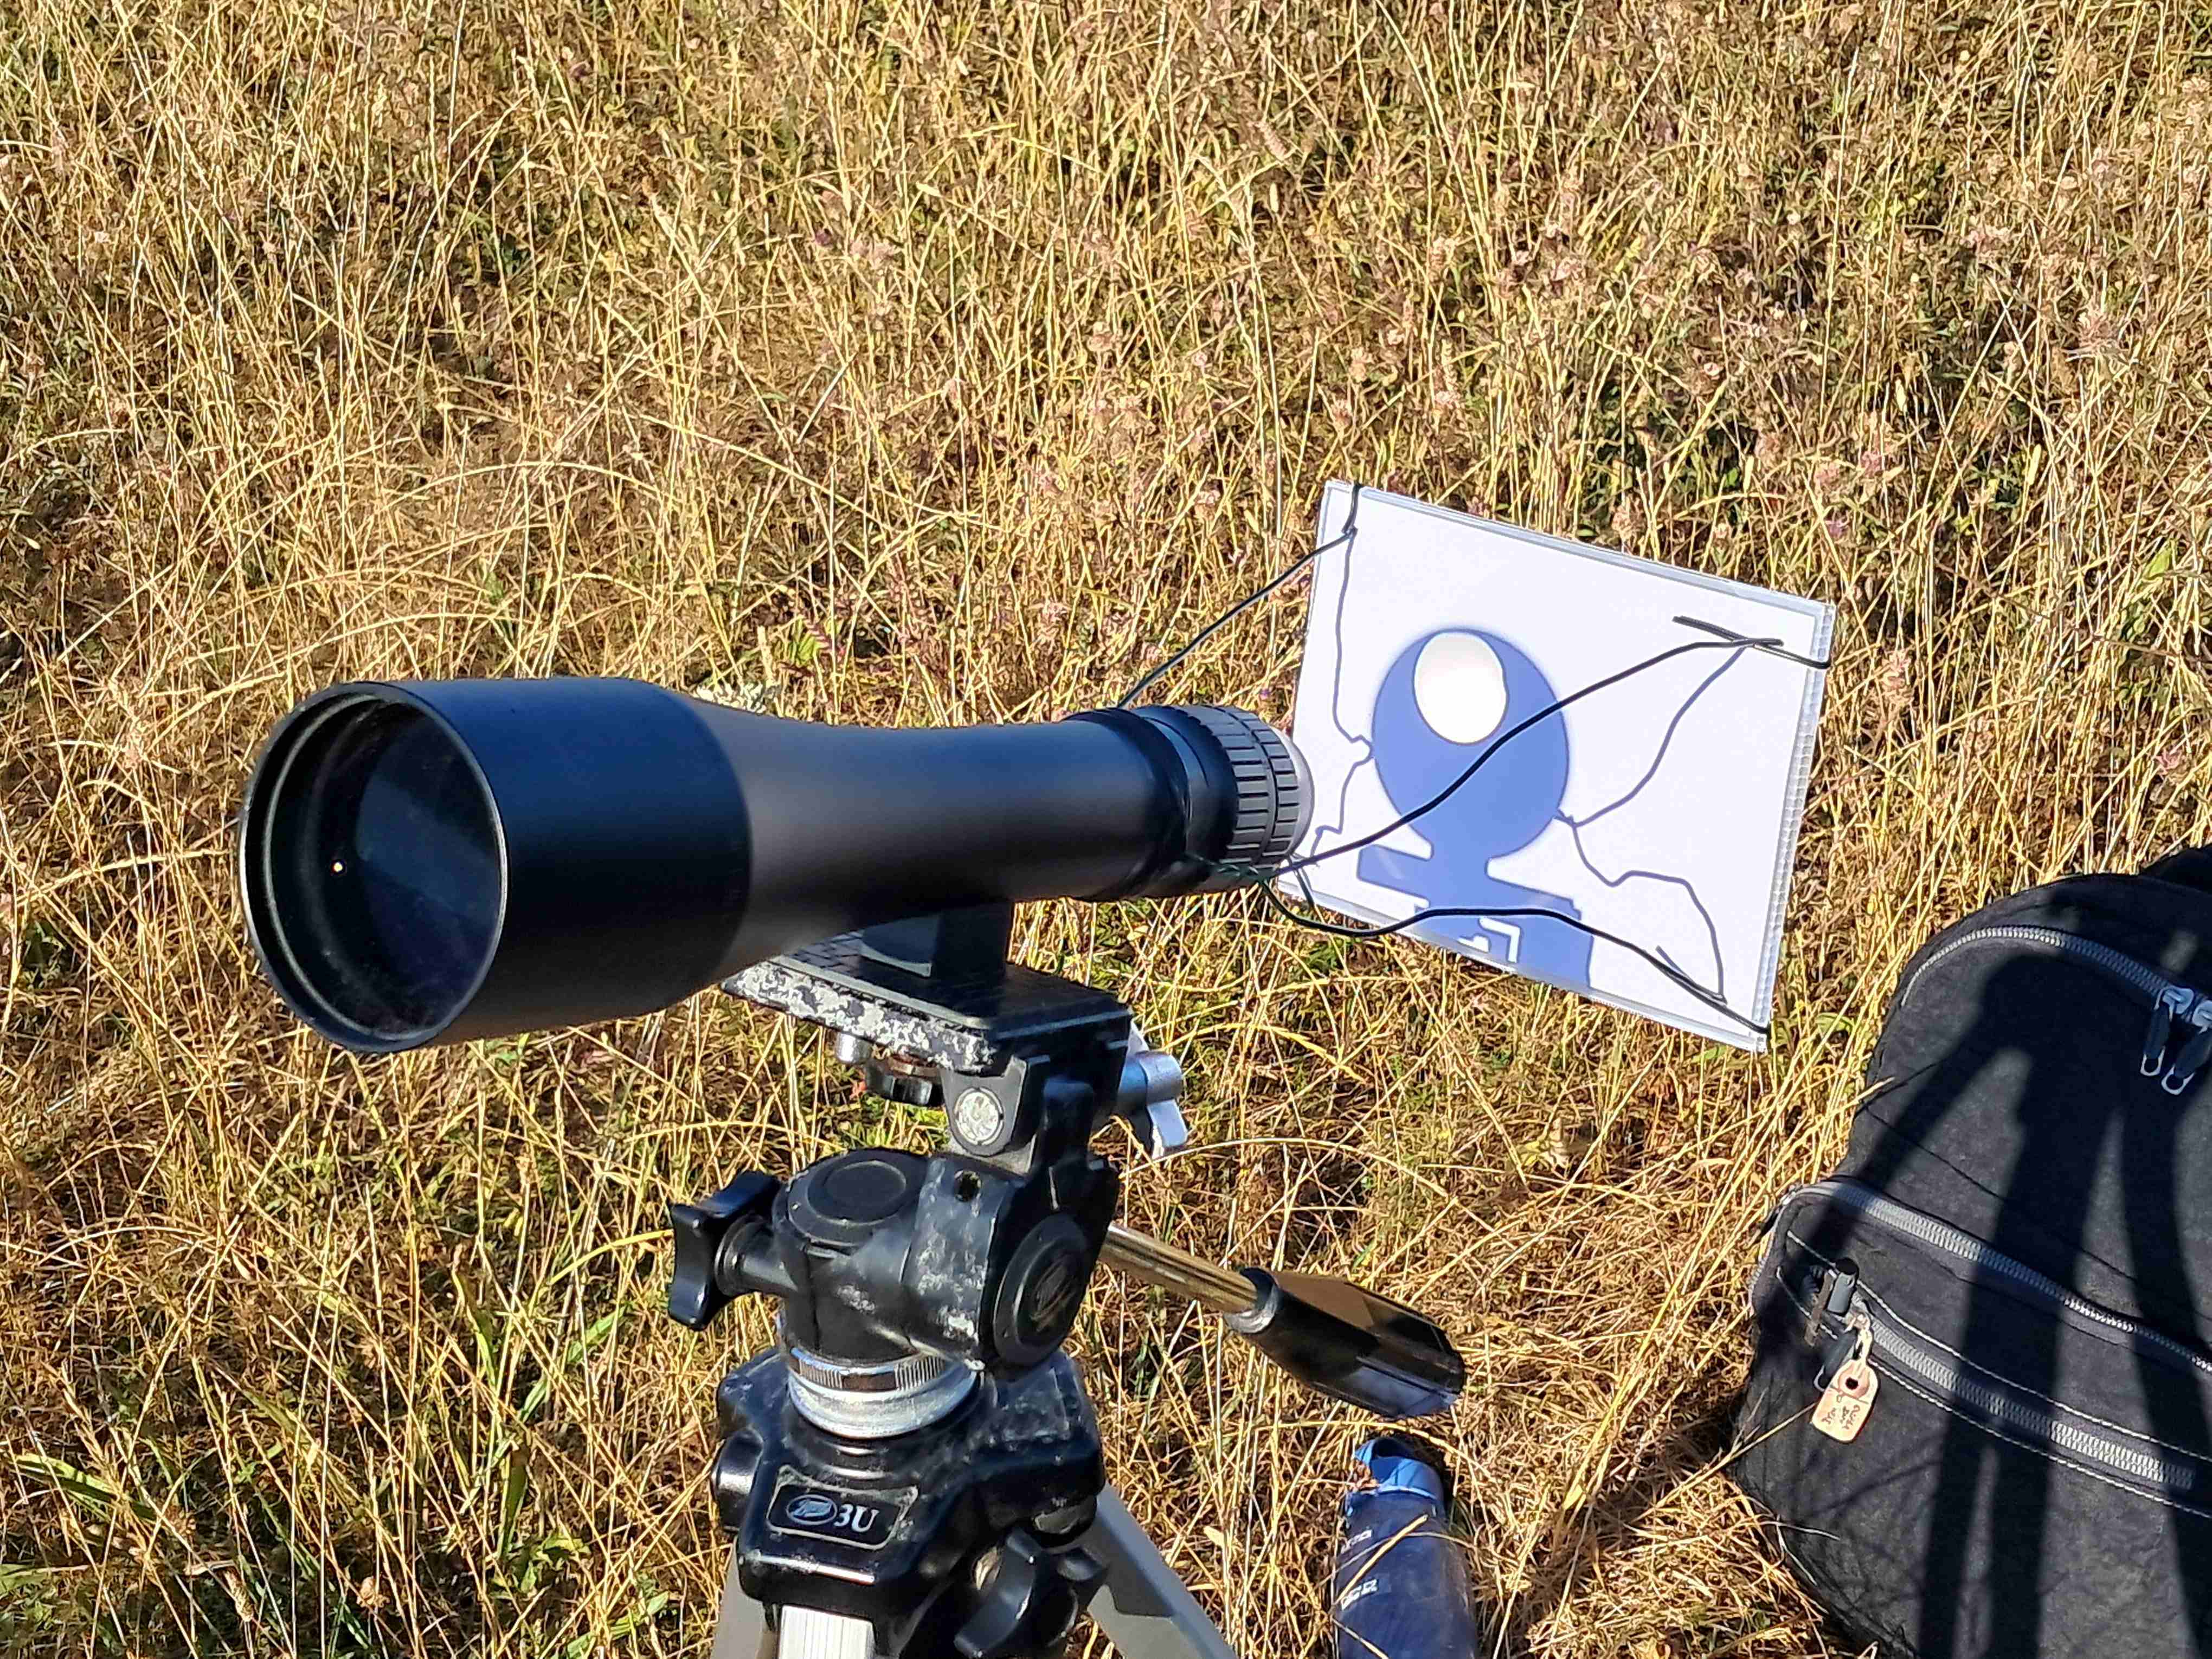
Because of how they were captured, all of the images of the sun on this page are upside down. My eyes and cameras are too precious to risk by looking directly at the sun, no matter who says the filters available today are sufficient protection.
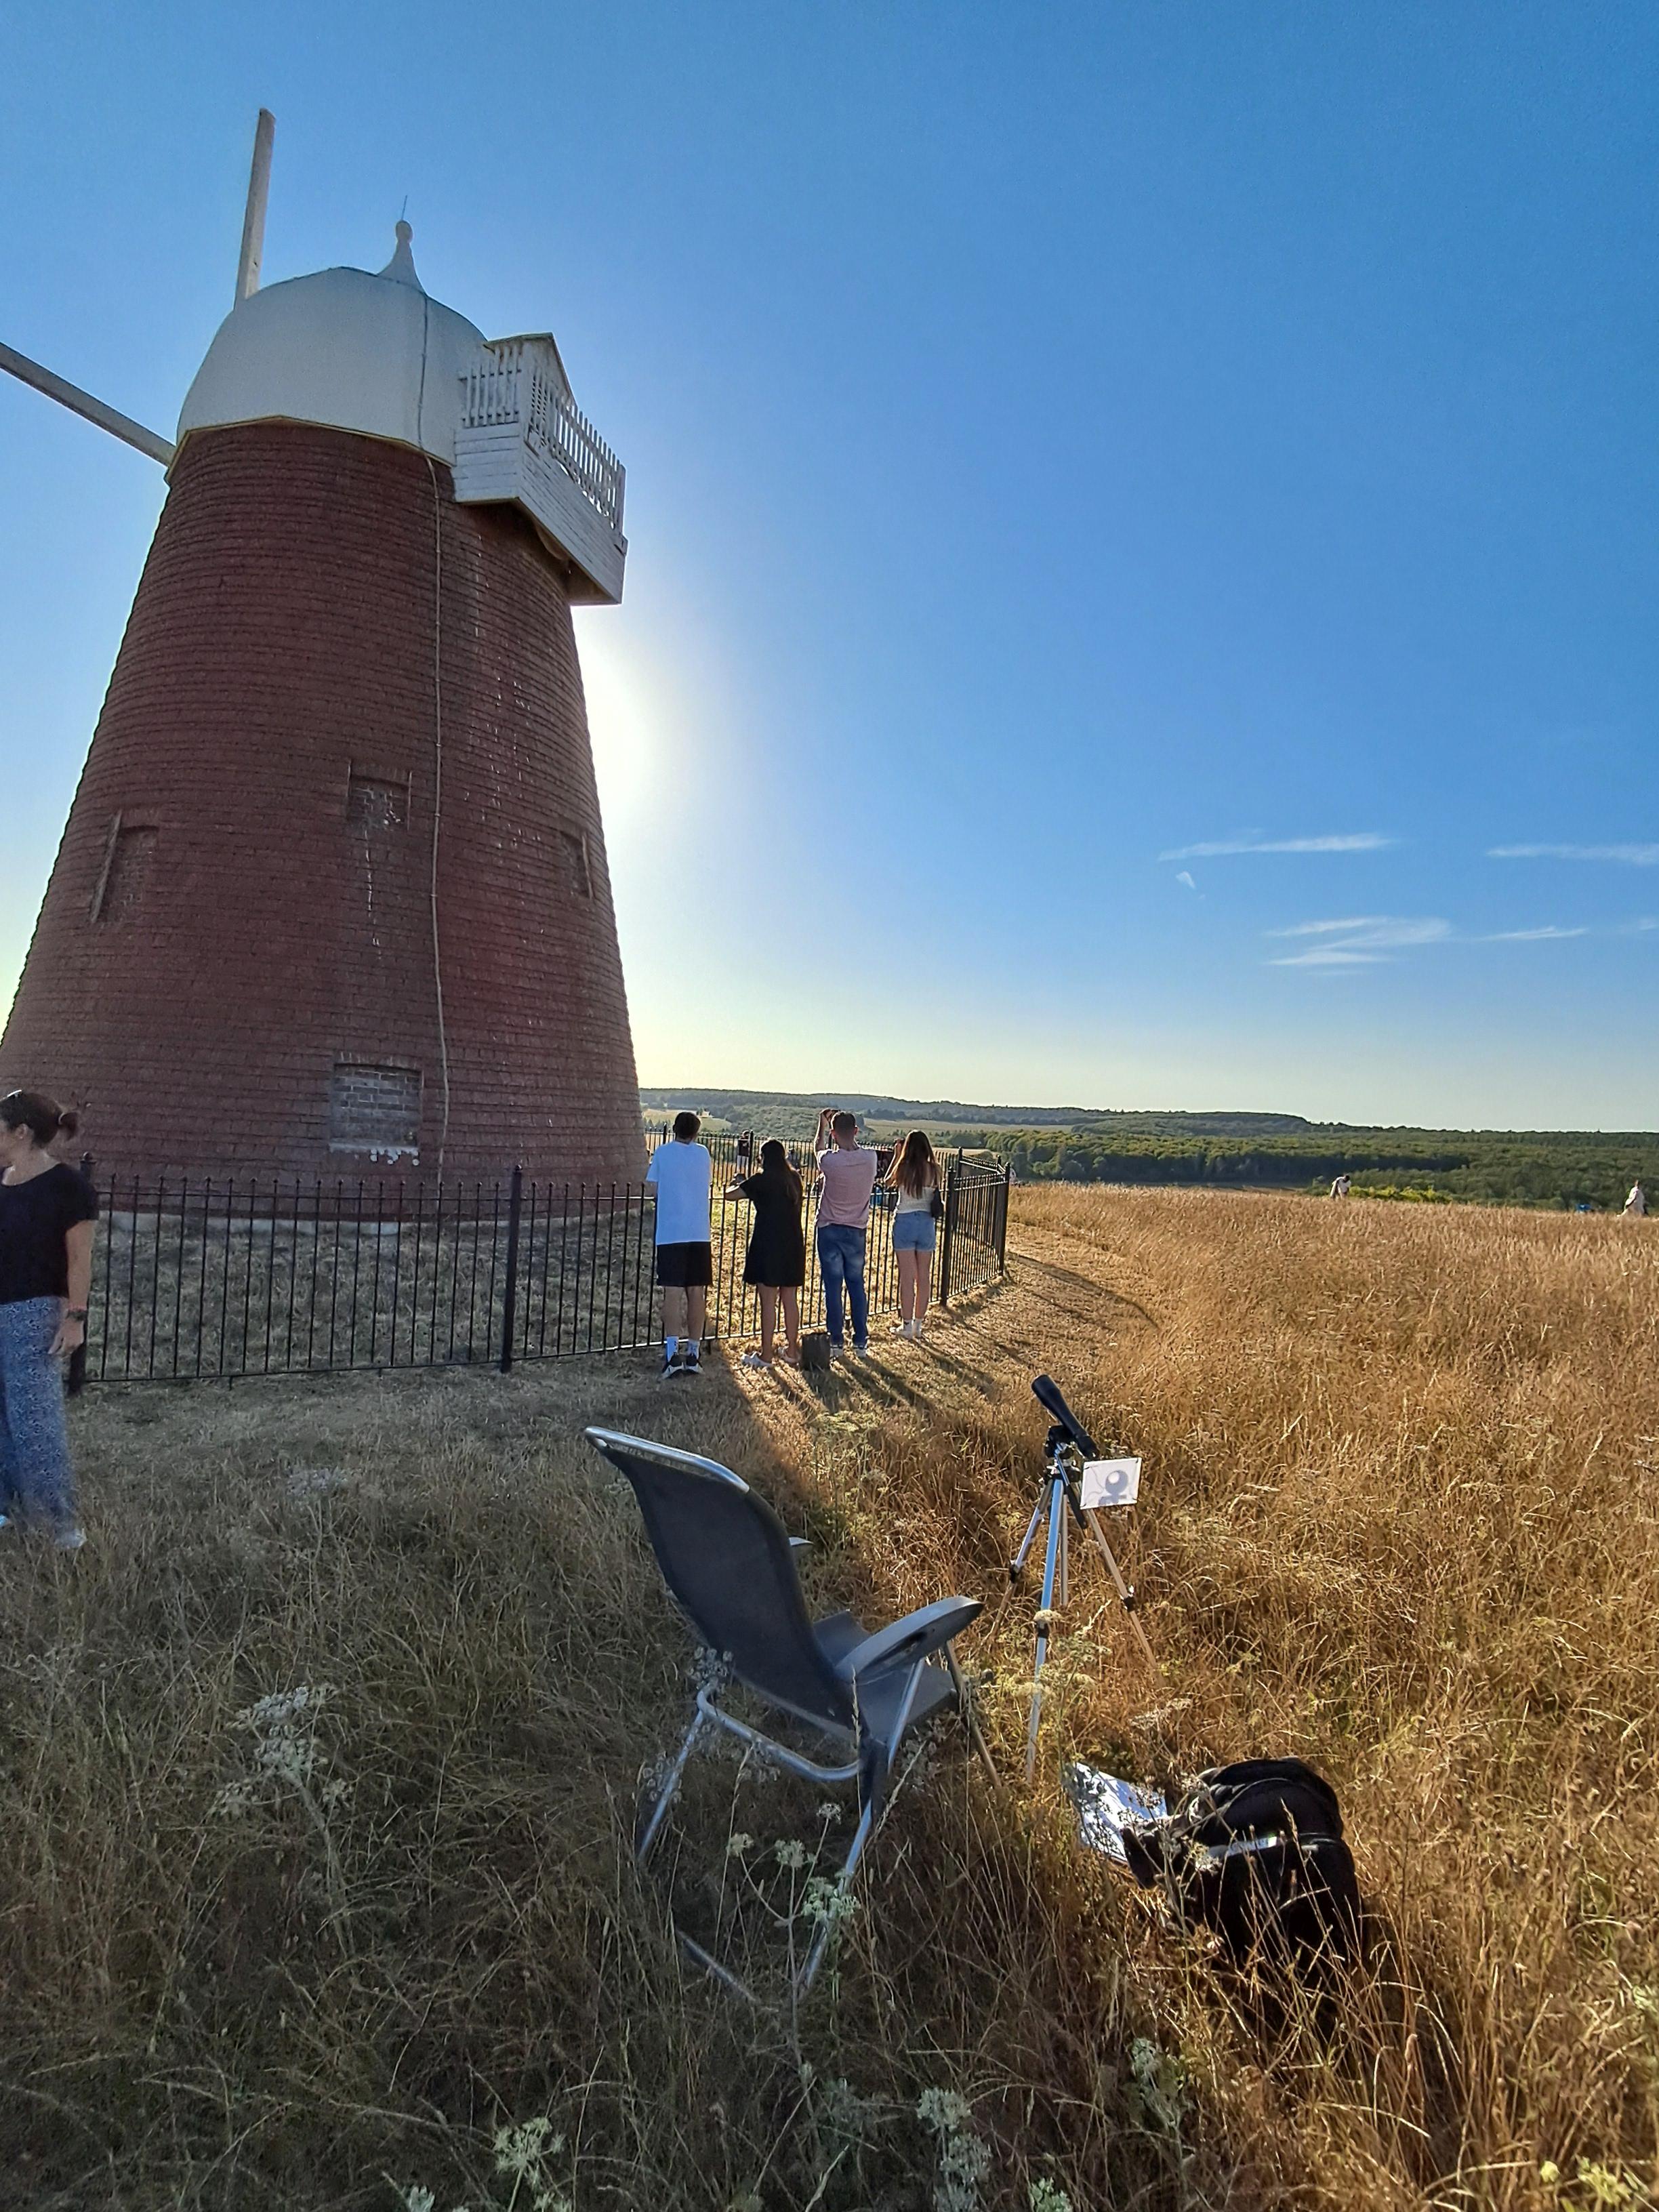
Beautiful Halnaker at about the time of the eclipse, on a quieter day. To access the mill, you hike up a farm track which was a Roman Road, through a gorgeous "tunnel" of trees. (There's no vehicular traffic on the track, it seems likely that it is barely changed from how it was in Roman times. Very atmospheric!
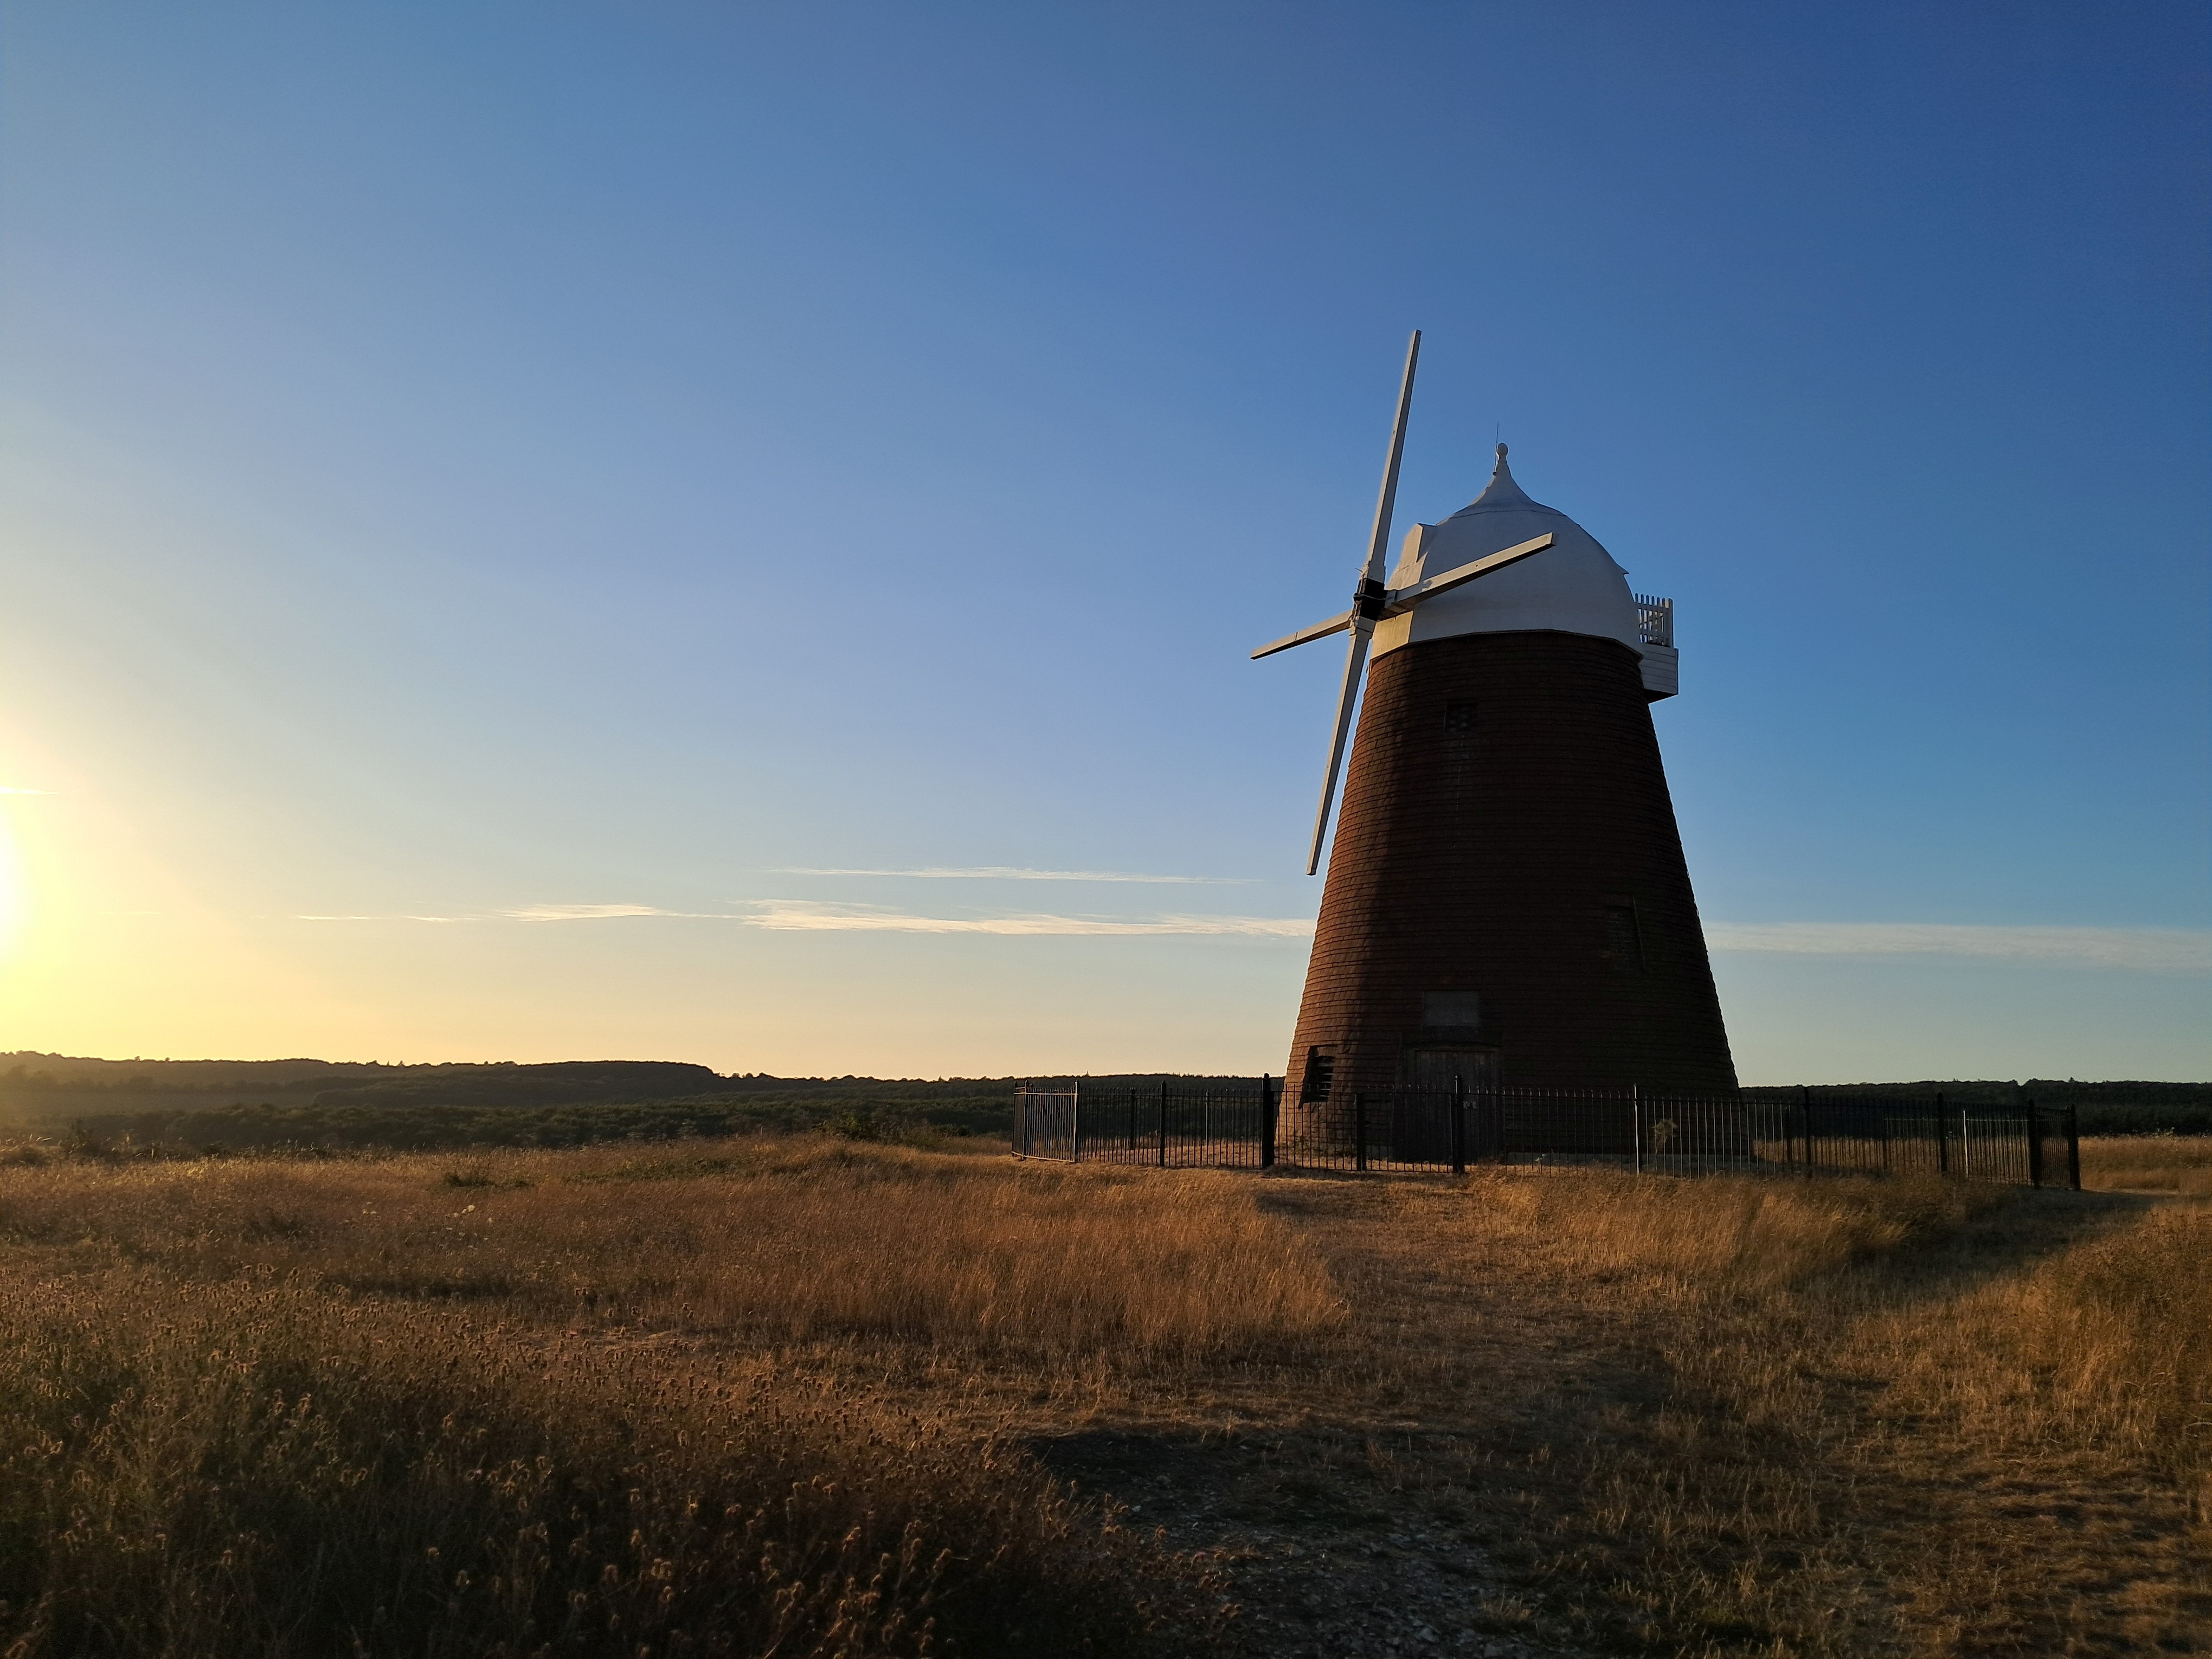
From the mill, you can see the Isle of Wight, Portsmouth, Chichester Cathedral, Bognor Regis, Littlehampton. (Isle of Wight to Littlehampton: about 25 miles.)
I go up to the mill most days, for the exercise. It's a hard life... not.
In 2015, I thought it might be fun to try to measure the brightness of the sky and the air temperature, across a day when there was a solar eclipse. And I succeeded, to a certain extent.
I did it again in 2025, and again during the August 2026 eclipse. This page reports on the 2026 attempt.
Details of 2015 attempt
Details of 2025 attempt
(The pages should open in new tabs. Depending on how your browser is set up, you may need to switch to the new tab to see the page. (It can be set to switch to newly opened pages... worth doing!) Just close the tab to come back here.)
You may wonder if all of the detail you'll see below is necessary.
No! It isn't! But for some of us the fun is in the details. If you don't get fun that way, you have my commiserations.
Writing all of this up rewarded me with at least two discoveries. They were things I would not have noticed if I hadn't been thinking about the day in order to write this.
It also led to a message from a friend recommending an amazing YouTube with further marvelous things to think about... and watch for, next time! (More on this later, under "Amazing! And Next Time!".)
The 2026 attempt had everything going for it. While most things only needed plugging in again, I spent hours checking, rechecking and tweaking... and almost everything went well!
It was a great eclipse...
It came near to being total where I was.
The sky was nearly cloudless all day.
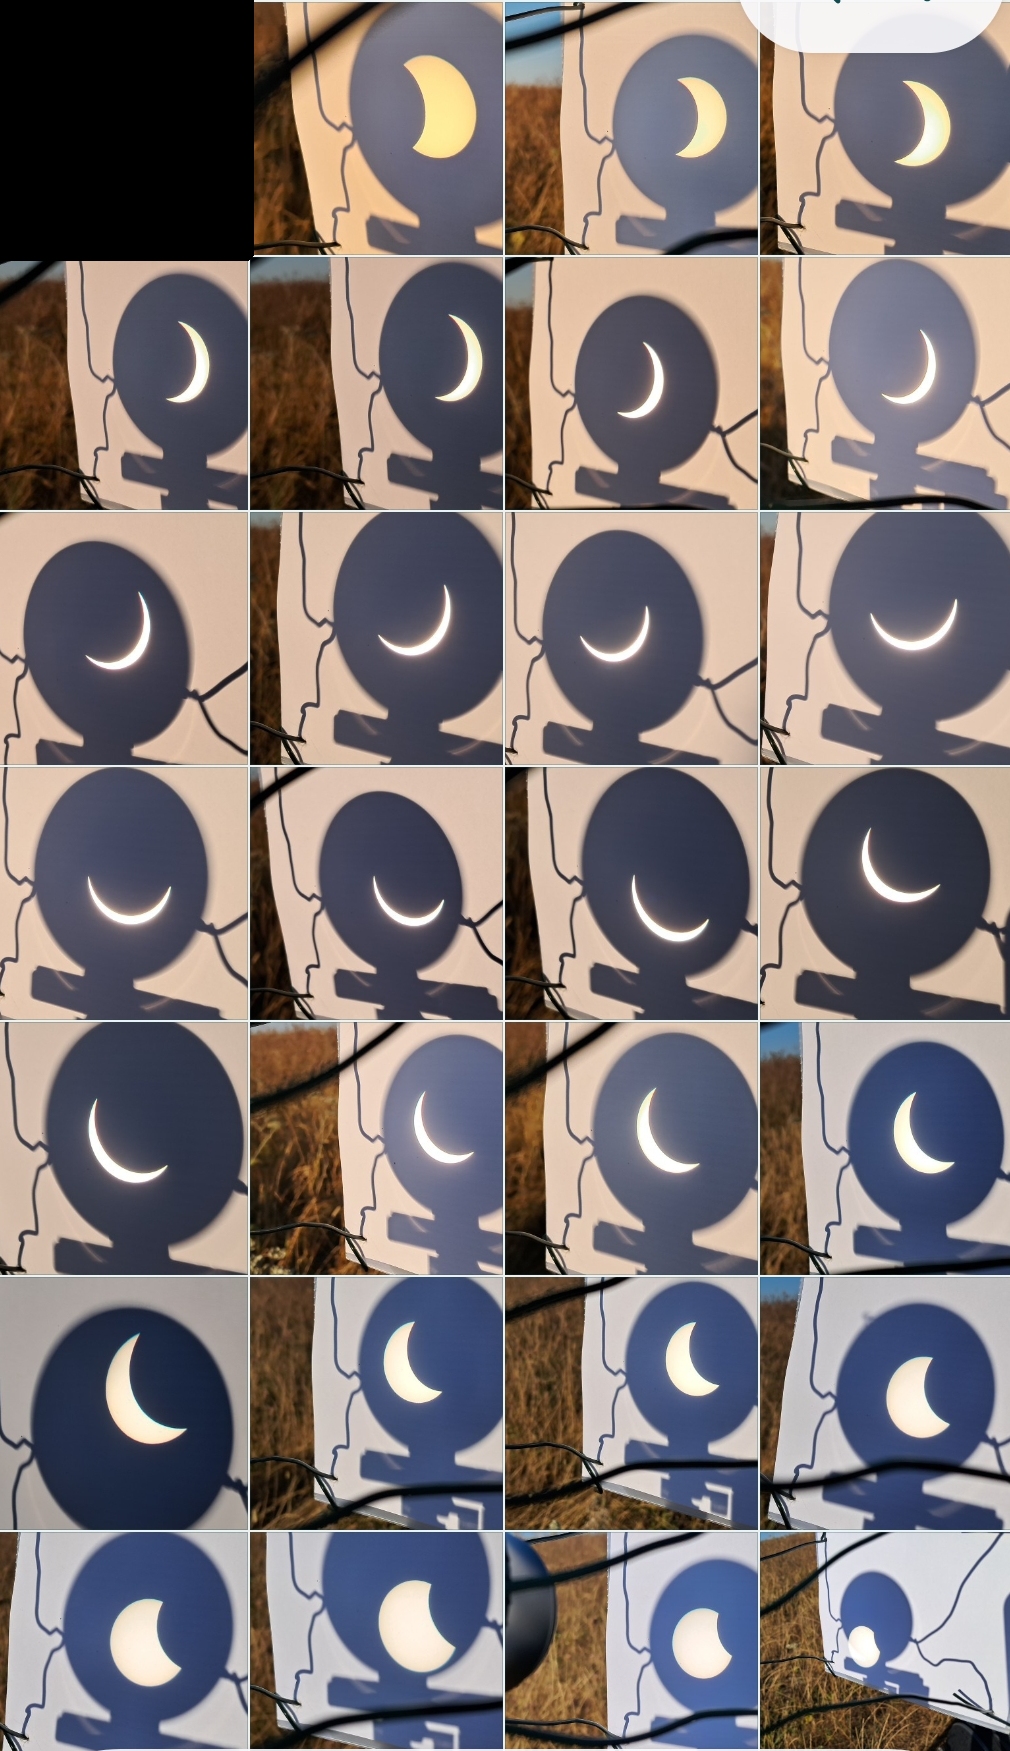
Here are the photos that were used to make the animation at the top of the page.
Read the montage "backwards"... the earliest image is at the lower right. Go left from there, then up to the right hand end of the next row, and so on.
The "first" image (upper left) is the one that was taken LAST. (I left exposure and color balance to my Android cell phone's automatic systems. While it may have changed the exposure while the sunlight was less bright, and the color balance setting may have changed, I think the gradual shift in hue is a record of an actual shift in the color temperature of the light we were seeing.
------
My light level and temperature recording equipment performed without any hiccups. This was the third time I'd used it for an eclipse.
... but I paid a heavy price for not bothering to site the sensor well.
But it was still fun! And a great "learning experience".
I didn't (and don't!) think that this data will ever be of any use to the larger astronomical community. That wasn't the point of the exercise.
I just wanted to see if I could do it... and I had fun with that!
In a moment, I'll give you the results, and explain what I did so that you can try what I tried, or at least think about it all. What was clever, what was dumb in what I did? If you were doing it, what would you do differently? What other things can you think of which might be tackled using elements of how the solar eclipse was recorded?
Just what I did with my spreadsheet to create the graph may be of interest, and I will (eventually) explain it. (That part IS NOT YET WRITTEN!!!
I was hoping for something like...
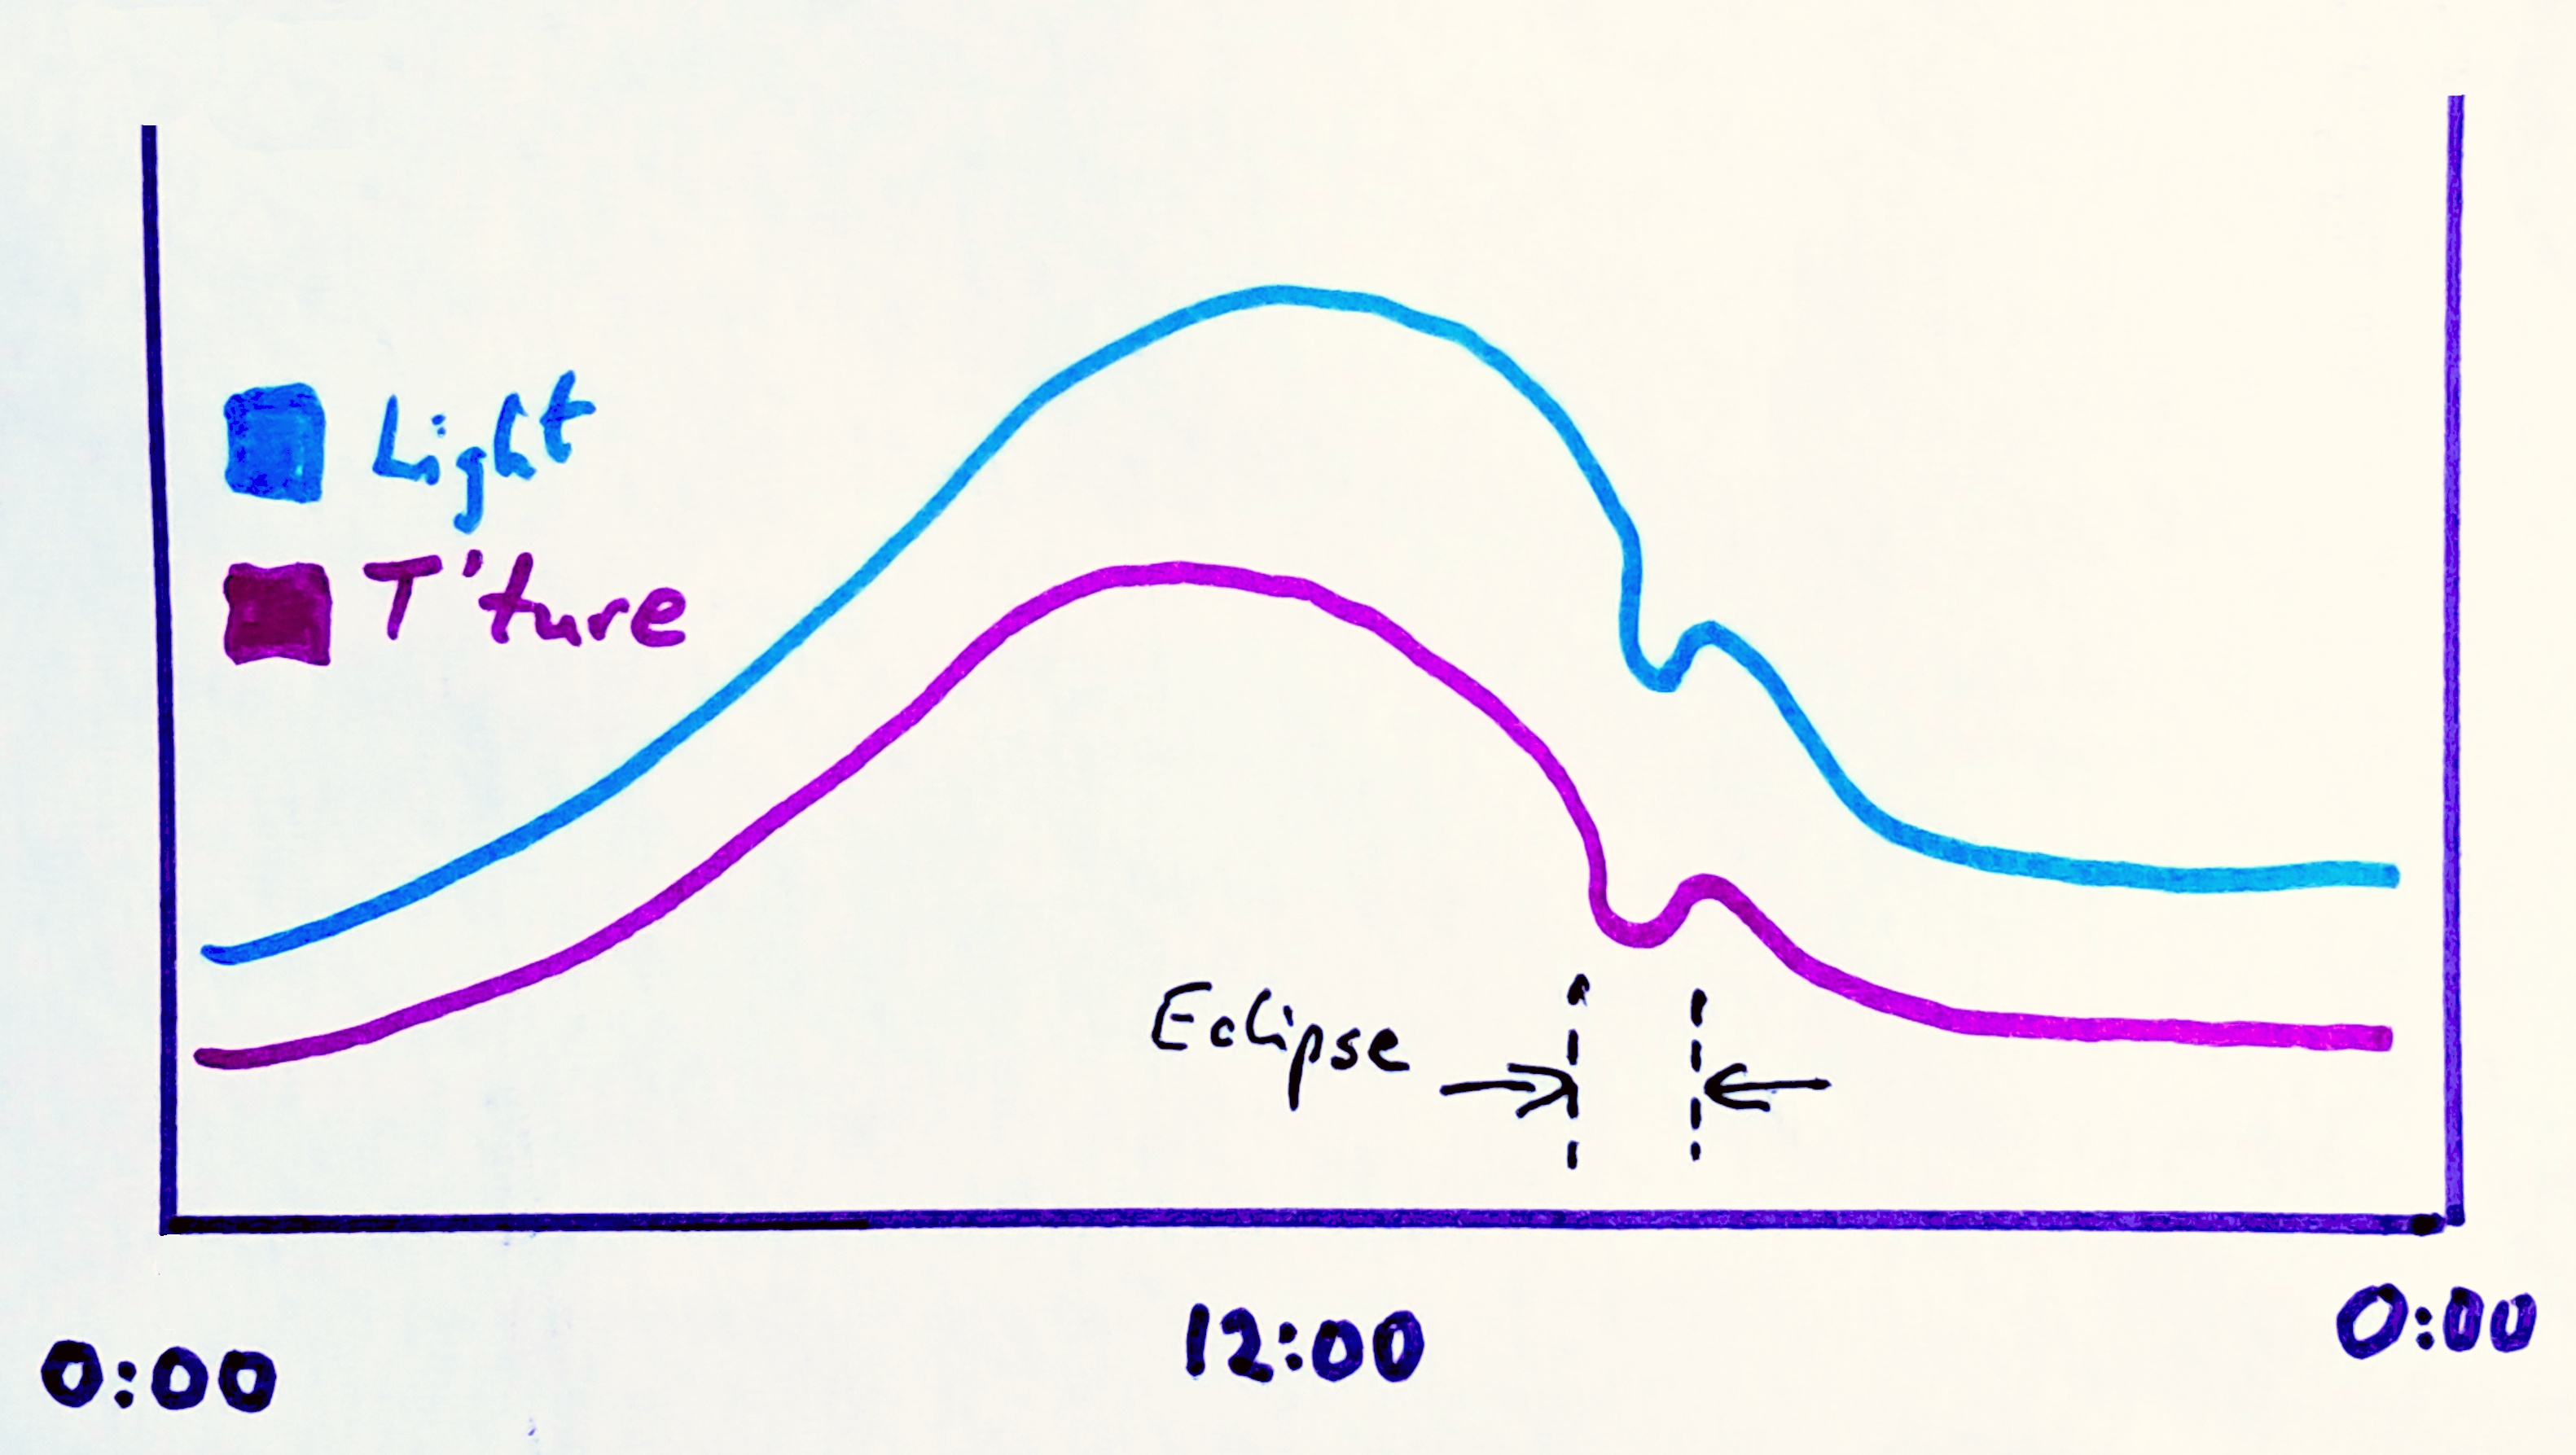
What I got was what you see below. That's my graph of light and temperature for all of 12 August, 2026, from near Halnaker Mill. (Southeast England, details above.)
(I watched the eclipse from the mill. The electronics which captured the data were not far from the mill.)
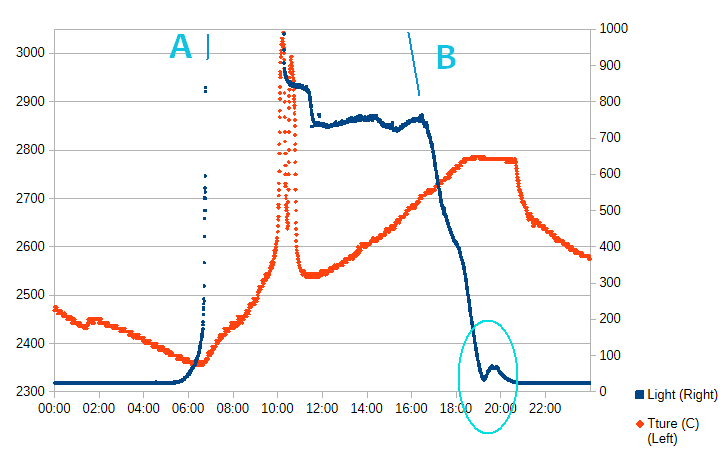
The red line shows the temperature. The blue line shows the light level.
The eclipse does show on the graph! (^_^)... It is the downward blip that happened around 19:00, marked by the light blue ellipse.
For the moment, ignore the straight light blue lines marked A and B.
(You can download the data, if you want to play with it. This is discussed more fully further down the page.
eclipse2026-VSQ427-SolarEclipse-just_data.txt
We'll discuss the graph above more fully in moment... but first let's look at the part of the day near the eclipse...
We'll look at the record of the light levels first. Its shown by the falling blue line.
The graph shows the data from 2 pm to 9:30. (14:00-21:30)
I'm not sure why the light level was steady from 14:00 to about 16:00, but the decline (of the blue line, light level) starting at "A" (about 16:00) makes sense. During this part of the day, the sun was moving down the sky. The light was striking the atmosphere more and more obliquely, and gradually getting weaker by the time it reached my sensor.
The dotted line (cyan) was added by hand, after the graph was drawn. It tries to interpolate the trend that ran from A to B, and continued from C. The dotted line shows what I think the light levels would have done if there had there been no eclipse.
Yes... the sensor was badly sited, as I will discuss later. But I believe the effects of the siting were consistent from at least 14:00 until the end of the day, and thus did not affect the pattern seen.
So... a success?
I did learn something from the experiment!...
I was surprised to see that it took longer to get to the maximum effect that it took to get out of it. I hadn't noticed this while experiencing the eclipse. I only saw it when I looked at the graph. (I'd expected a more symmetrical phenomenon.)
I think I've figured out the cause.
My guess is below for when you want it. Have a go at figuring it out for yourself! But when you are ready, select the blank area below, and you can see my guess. (I.e. "drag" your mouse across it.)
You have to factor in the fact that the earth was spinning while the shadow was moving eastward (as well as southward) across the globe. And thus, the sun went closer and closer to the horizon. The light struck the mill at an increasingly steep angle.
The earth was of course spinning to the east. The shadow of the moon moved across the sea and land from northwest to southeast. (It moved faster than the earth was spinning, so where it hit the earth moved eastwards during the eclipse.)
I only realized that the shadow was moving eastwards while writing this page for you. I just assumed it would move the other way. (Maybe I imagined it went westward from my awareness of sunrise moving ever westwards?)
A splendid animation on YouTube (only 120 seconds!) of the view from space set me straight.
I had assumed the wrong direction, so, as I said, thank you because this essay led me to one of those "Oh!" moments.
Ummm. I'd forgotten that the temperature sensor on the device capturing the light level readings was inside my home!
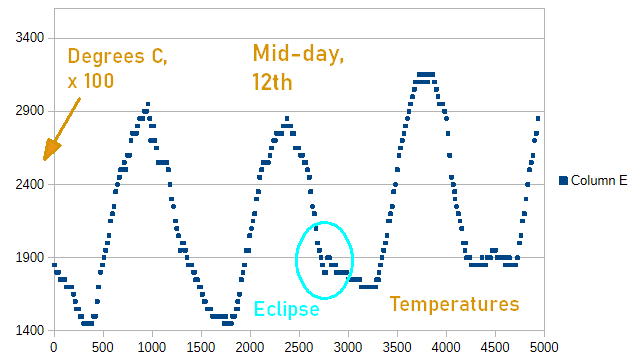
Happily, another system was also recording temperature data. Sadly, that wasn't at the same resolution, but in the graph below, you can see the dip in temperature caused by the eclipse.
The crudeness of the graph is due to the resolution. But two conclusions are possible if you look directly at the numbers which produced the graph.
The sensor is probably good to 0.5° C.
(Highest temperature recorded on the 13th: 31.5° C (88.7° F))
How the data for this graph was collected is explained on a page explaining my DS025 premise monitoring software.
Returning to the graph of the whole day, the one we saw earlier....
Sadly, the range of my light level sensor was limited. It turned dim light into small numbers. It turned slightly brighter light into slightly bigger numbers, and so on, but before the brightness was equal to direct sunlight, the sensor maxed out at 1023.
Happily, because the sensor was in an east facing window, and the eclipse was in the evening, I got away with that... up to a point. The sensor was reporting the different "quite bright" levels in the eastern sky when the sun was no longer shining directly on the sensor.
This seems to have worked, at least somewhat, in the hours around the time of the eclipse. Whew.
But, for fun(?) let's look at the light levels across the whole day.
Dawn seems to have come at around six. And at that time, the sun was shining directly on the sensor, and thus it maxed out very quickly.
I've put the lines marked "A" and "B" in by hand. It seems to me that they show the light levels going off the top of the page at about 06:15, and returning, on a sensible line, at about 16:00.
So what explains the low- enough- to- be- reported- by- sensor reading from about 10:00 to 16:00? I don't know!
Rather stupidly, I failed to realize that with the sensor inside the window, the temperature readings weren't going to show the temperature drop due to the eclipse! (The sensor was installed before 2015, and back then it hadn't occurred to me that temperatures during an eclipse would be interesting.) (Luckily, I had a separate weather monitoring system running, as explained elsewhere. Sadly it didn't take readings as often, and also its temperature sensor didn't have the resolution of the one on the Arduserver with the light level sensor. Oh well.
We can still have some fun with the red line tracing the temperature in the room! As follows...
The day concerned was in a week of exceptionally hot weather. Each evening, I opened my windows to exchange the hot air in the house for the cool air available outside.
The numbers on the left side are the scale for the temperature line. "3000" stands for 30.00 °C (86.0° F). (2300: 23.00°C. (73.4° F).) I'm sure the sensor cannot resolve 0.01°, but it is probably good for a fraction of a degree.)
On the eclipse day, we see the room at about 24.8 at midnight, cooling steadily. Why is there a uptick a little after 01:00? I have no idea!
At dawn, the temperature of the sensor beings rising sharply. As you would expect. Also, about dawn, I shut the house up to trap the relative coolness gathered through the night.
But what happens around 10:00?!
My guess... the sudden increase in rate of rise coincided with the sunlight falling directly on the sensor. (It is a DS1820 in a small blob of black plastic)
And why the sharp dip before the new upward spike until the event was over at around 11:00?
The window is in several sections. The sun was moving west across the sky. I'm guessing that the steep "valley" in the middle of the event is the result of the shadow of one of the section-dividers passing across the sensor.
(That's version 3 of my analysis. I'll spare you my first two theories. Who knew there was so much thinking possible from a silly little "record the temperatures" exercise?!)
Moving on...
Remember... the sensor is on the window sill, inside an east facing room.
By noon, we're back on the trend that was established from 07:00 to 09:00. Hot day. House shut up. It gets hotter!
12:00 noon to 19:00... the house gets hotter and hotter.
Why the line goes flat at about 19:00 I again can't explain. Yes, there was the eclipse. Yes, the sun set at 20:30 (Thank you TimeAndDate.com)... but the sun's power to heat the earth in the run-up to being fully set fades. And the house was shut up.
I can explain the sudden change at about 20:30: That was when I opened up the house to repeat the previous night's overnight cool-down.
So! There you have the light level and temperature stories. Probably very dull! But record some temperatures (or other things!) of your own, and see what fun you can have with trying to explain the graphs you get.
You could do something similar, but I have to warn you... there are a few "ingredients" to assemble...
First you need something with sensors which can serve web-pages. An Arduino is ideal. An Arduino "just" serving on a LAN will do. (I call these things "Arduservers". How you can make your own is explained in a moment.)
You need to arrange for a line to appear in the page served up by the Arduserver (or equivalent). That line needs to present the data from the sensors in a specific format.
Once you've got that, but "only" that, the rest is easy! I am giving away the program you leave running on some computer on the LAN.
The program goes to the web server periodically and fetches the page offered by the Arduserver. The program then extracts the data, and gives you a CSV file. (There are links from there to the "how to set up the Arduino" part... it is my "FarWatchWatcher".) The web-page was offering FWW008 at the time I am writing this. If there's a different FWWxxx on offer when you go there, it should simply be a bigger, better FWW008.)
The same page has a link to another of my pages. That page tells you about creating a suitable Arduserver. Not complicated. Really! Not expensive! (About $45... but that includes the two $10 sensors you need.)
The Arduserver tutorial that the page links to at the time I'm writing this...
wywtk.com/ardsrv/ardsrv_23518_2t2h_door.htm
... explains making one with two temperature/ humidity sensors attached to it. You need to replace at least one of them with a light sensor. You could replace the other one with a less expensive temperature sensor if you want to save a little money. Modifying the code to achieve those requirements would not be a big task.
If you created the new Arduserver to copy the way the old one reported the sensor readings, then the software used for the old Arduserver would work just as well with the new one. Making the Arduserver copy the old way would not be hard.
The Arduserver I actually used was created in 2015 or earlier. There would be little point in building a new instance of exactly that Arduserver. I only used it because I already had it!
The good news: ardsrv_23518_2t2h_door.htm has some clever stuff in it for using an interrupt service routine to monitor whether a door is open. You can forget all about all of that if you only want to track a light level and a temperature.
If you do decide to make your own Arduserver for this, as long as you make it do the following, it will work with the software I'm giving away.
The html returned from the Arduserver I used for all three eclipses has things like the following for the 7th and 8th lines of the "raw" html, i.e. what you see if you ask your browser to show you the "source" of a page...
<!--NeXtLiNe4FWWdf001. (http://sheepdogsoftware.co.uk/ssdd67.htm)-->
<!--0001+244310220278-->
The 8th line holds the data, as follows...
The first four characters are not important to our wants. The 5th character should be a "+". The next four should be "2035" if the temperature is 20.35 deg C. The next 4 should be the light level sensor's reading. The final 4 aren't important to our wants.
(The 7th line may not be important... but it may be. Put it in thus to be on the safe side.)
PLEASE... if you go and look, and think "that would be fun", even if you don't have time to try it yourself, spread the word? Making all of that (and this page, for that matter) was a lot of work. I begin to wonder if I should bother, given the amount of traffic that I get. But you've read this far... you must have enjoyed it at least a little bit. PLEASE TELL OTHERS! Give it a Facebook "like", mention... Whatever! (^_^) "advertise"...
https://flat-earth-academy.com/sci/astro/eclipse2026812.htm

... or... (takes you to same
   place, but easier to convey!...

https://bit.ly/eclipse2026graphs
... in a blog post. SOMETHING? *Please*?
I present the following to offer a challenge to you, gentle reader.
I'll show you the raw data, as recorded by the program that read the Arduserver.
I'll give you some notes on how to read the data.
The challenge: Can you put that data in a spreadsheet, and get the graphs I've made for this webpage.
I did all of that with a simple text editor and "Calc", the spreadsheet which is part of LibreOffice. (I'm a great fan generally of Libre Office... not least because it is FREE!)
You can download the data I used to make the graphs...
eclipse2026-VSQ427-SolarEclipse-just_data.txtI've helped you a bit. The file you download is simpler that the text file it was in. That looked like...
26810x22,0,255,3723,+2618,0026,0114,xxxx,,, 0
26810x22,0,255,3728,+2618,0025,0136,xxxx,,,10
26810x23,0,255,3733,+2612,0024,0144,xxxx,,,20
26810x23,0,255,3738,+2612,0024,0107,xxxx,,,30
26810x23,0,255,3743,+2612,0025,0075,xxxx,,,40
26810x24,0,255,3748,+2612,0025,0098,xxxx,,,50
(There were 4307 lines like that.)
I asked Calc to treat that as a CSV file, and loaded the data into 11 columns. That seemed easier than massaging the file to throw away the things that didn't interest me. I've reduced the file to only the things you need in the version for downloading...
date/time	ttur	light

26812a00	2468	24
26812a01	2475	24
26812a01	2468	24
26812a02	2468	24
26812a02	2468	25
26812a03	2468	25
26812a04	2468	24
26812a04	2468	24
26812a05	2468	25
(The actual data has more lines between the first and last shown above. I trimmed it a bit here.)
From right to left...
The units for the light (light intensity) are arbitrary.
The units for the temperature are degrees C x 100. In other words, if the data has "2468", the temperature was 24.68° Celsius. (76.42° F.)
Date/time...
Hold onto your hat! The following may seem strange. Doing it thus has advantages, but to make a graph with date/time on the horizontal axis will mean you need to massage the date/time. Start by creating columns for each element, and then combine them to give you "minutes since midnight". Use THAT for the x on your graph. (But present it as an ordinary Time of Day, of course!
26812a00
yymddhmm
"26812a00" stands for...
So! "26812a00" stands for 00:00, 12 Aug 26
There you have it! All you need to turn the numbers in the file you can download into a graph. (That plus some hard work.)
You're trying to get this graph, by the way...
Be sure to include the labels to say that the blue line shows light, and it's scale is on the right, and that the red line shows the temperature, and it's scale is on the left. You can do a BETTER job than I did if you show the scale running from 23.00 to 30.00, not the 2400-3000 I have! Be sure to show the times as hh:mm, not the "minutes past midnight" used to plot the figures.
I had the very good fortune when I was about 11 years old to see a total eclipse, in good weather. Very memorable, of course.
Even with the good weather we had for the March 2025 eclipse, where I was it was only partial... about 30%... hardly noticeable, unless you knew how to "see" it.
The 2026 eclipse, 93%, was much more dramatic... but still, alas, we never had "darkness". We got into that beautiful yellow light, not intense. (Before and after the eclipse, the sun shone down fiercely! We were in the midst of a heatwave at the time, and had had no rain for many weeks. (Oh. Except for the 1.5mm that fell one day.)
For the 2015 eclipse, the nice people at the Goddard Space Labs did some great, and not "ordinary" visualizations, which you can see, with narration, in this 60 second clip at YouTube.. (I have included that bit of "old news" in this because the visualization so impresses me.
You think I get carried away, tunnelling down rabbit holes?
A friend commended the following...
https://www.youtube.com/watch?v=J1WoNuemKOg
It's a splendid 22 minute collection of wonderful analysis. VEry engagingly presented.
Lots of wonderful facts explored... for instance "How many total eclipses have happened/ will happen per year between 2000 BC and 3000 AD?"!
In the YouTube just mentioned, the "shadow bands" that you might see briefly, if you know to look for them, are explained. What they are. Not why they are. No one knows... yet! (According to the video)
And at 13:10, there's a fun phenomenon to watch for, in even a partial eclipse. (Effect of rotating had- with- fingers- extended shadow.)
Go on... view the YouTube... you know you want to!
====
Don't you admire the early astronomers who worked out from first principles what the direction of the shadow's travel would be? And the modern astronomers who can tell us in advance exactly where it will be when?
I mentioned TimeAndDate.com earlier. You can learn about upcoming eclipses, solar and lunar, worldwide, from www.TimeAndDate.com/eclipse. They lay everything out well.
I hope the material above amused you? If it did, you might also enjoy...
my account of seeing the 2012 transit of Venus
or my already-mentioned accounts of similar attempts to record solar eclipses in 2015 and 2025.
This is digression... Notes I wrote 9 days before the 2026 eclipse...
I have had quite a lesson in the costs of not doing things properly this afternoon.
Another eclipse is coming. (12 Aug 26). I wanted to be sure I was ready to record it... but when I went looking for how I did it last time, I could not find those details. I could not find the page for the 2025 eclipse!!!!.
Sigh.
After a long and disconsolate search, I finally found it. Whew! Hurrah!
But, as I half suspected, the "how I did it" information was not there. (I wanted that in order to set things up to do it again for the eclipse this page is about.
So, better late than never, not that there's much in it of use to you, for MY purposes...
The hardware used to capture the light level data:
   The "Arduserver 3" at NC on LIPA.240:81"
     (In 2025 I'd made an entry about that: "Does work!
        Not used for YEARS, tends to seize up,
        and did so at bad time 29 Mar 25")
The software used harvest readings from the
   Arduserver: a version of FW099.
Datafile massaged, graph created with LibreOffice.
The spreadsheet: VSQ424-SolarEclipse.ods
   (Copy on PCva25aug, 3 Aug 26)
For my attempt to record the 12 Aug 26 eclipse, I used the program and ini file in...
   (PCva25aug) Documents\Prgms\TKB-priv\fww009vers\
         fww009-25b16-1340 nc 240-81 solar
So. There you have it. At least, for once, I didn't attempt to set things up at the eleventh hour. Now all we need to do is pray for a clear sky. As we've had almost no rain here in southern England from 13 July (or earlier) until today (3 Aug 26), it is a bit perverse to pray for no rain. But that's only for the evening of the 12th. (Oh. And then there's the fact that my broadband connection is scheduled for a massive upgrade/ overhaul/ router replacement, etc on the 11th. What could possibly go wrong?)
In 2025, there was a flaw in the formatting of the recorded data. There was nothing wrong with the version of FWW009... but there was a flaw in the ini file used.
At 3 Aug 26, it seems that the version then in "PCva25aug...Documents\Prgms\TKB-priv\fww009vers\fww009-25b16-1340 nc 240-81 solar" is the way to go. A slight tweak of the ini file will get that version to parse the data in the properly. (Without the tweak, the data is still complete... just badly parsed.)
Critical lines in ini file...
[MainElements]
IPAddr=http://192.168.0.240:81
WhereFmtCodeLineIs=6
CodeForTypeOfDataSource=1
KludgeDeviceServed=Ardu3
Some may be contradictory! But the program will obey the one(s) we need it to for the Arduserver with the light level sensor.
Search across all my sites with the Google search button at the top of the page the link will take you to.
Or...
|
|||
| search engine by freefind |
The search engine merely looks for the words you type, so....
I have other sites. My Google custom search button will include things from them....
One of my SheepdogGuides pages.
My WYWTK... "What You Want To Know"... site.
My site at Arunet.
How to email or write this page's editor, Tom Boyd. Please cite "FEA... Eclipse2026812.htm".
 Page has been tested for compliance with INDUSTRY (not MS-only) standards, using the free, publicly accessible validator at validator.w3.org. It passes in some important ways, but still needs work to fully meet HTML 5 expectations. (Copy your page's URL to your clipboard before clicking on the icon, so you can easily paste it into the validator when it has loaded.)-->
AND it has been tested with...

 Why is there a script or hidden graphic on this page? I have my web-traffic monitored for me by eXTReMe tracker. They offer a free tracker. If you want to try one, check out their site. Neither my webpages nor my programs incorporate spyware, but if the page has Google tools, they also involve scripts. Why do I mention the scripts? Be sure you know all you need to about spyware.
-- Page ends --