HOME > >
FLAT EARTH ACADEMY HOME
Amateur recording of Solar Eclipse light levels and temperatures, March 2025
Flat Earth Academy
(filename: eclipse2025329.htm)
This is one of the Flat Earth Academy's "you might find interesting" pages. There is nothing here you "ought" to "know".
Besides this page, I have a similar, and probably better, page about the August 2026 solar eclipse. I would suggest you start there.
These observations from southern England, from well south of London.
The of 29 March 2025 eclipse lasted, according the almanac, from about 10:00(am) to noon. I found the following coincidence amusing: I wrote a very similar page about an eclipse seen from the same place back in 2015! In fact I used the same electronics. I'd unplugged, but not moved, them years ago, and had "moved on" with the relevant software. Wonderfully, if somewhat unexpectedly, both worked well with very little struggle! Just as well because I learned of the eclipse three hours before it began.
In 2015, we had clouds on the day... but in 2025 we had much better luck... nearly cloudless days on both the 29th and 30th. The cloudless day on the 30th was a help, as I hope you'll see from what follows...
Alas, this blew in at a busy time. There is more to come for this page in due course. Reading the account of the 2015 eclipse might help you understand better what is here.
In haste, highlights...
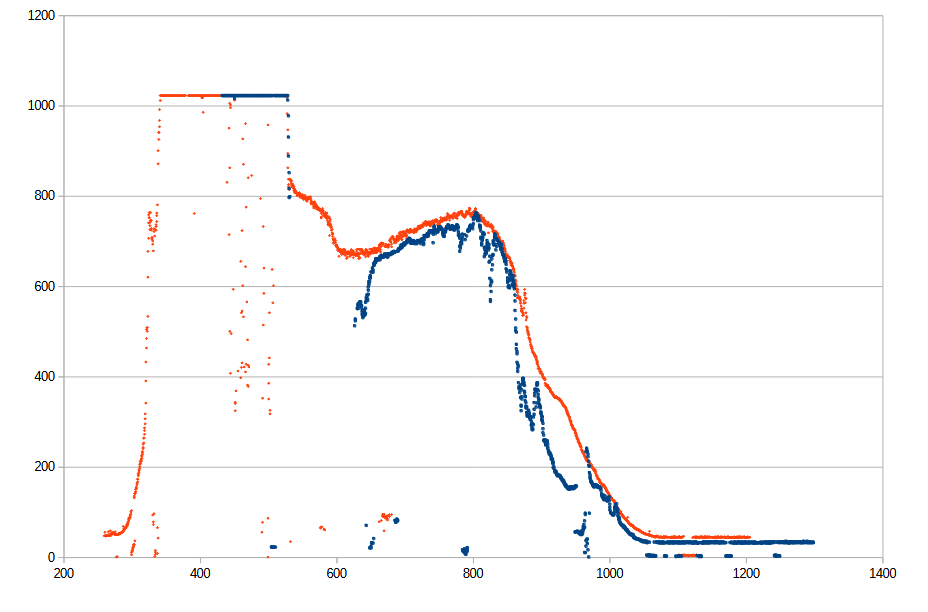
Two graphs in one...
In blue, the sunlight (as recorded by my imperfectly sited equipment!) on the day of the eclipse.
In red, the sunlight the next day.
The x-scale is in minutes... with a strange "zero"! (more on this another time!!)... runs from about 6am (200 minutes from "zero") to well after sunset.
Sadly, the first part of the eclipse took place before my sensor was reading the light in the sky properly either day.
But the sensor WAS WORKING from about the point of maximum eclipse. You can see the blue line "recovering" from the eclipse-low until it is nearly caught up with the "normal" line, as recorded in red, just before solar noon.
This is a digression...
The spreadsheet which generated the graph, with the data for the eclipse plus a reading every 20 seconds for all of the next two days, is online for you to download. (735kb). (Adding the graph for the third day would be simple... if you have the time. I don't, after writing the rest of this!) Beware! The commas are in the wrong place in the datastrings as returned from the Arduserver. (The spreadsheet "fixes" that. Also: The daylight savings status changed on the midnight between the 29th and 30th. Sigh. The file is in the .odt format used by Libre Office. The data in the spreadsheet also has a temperature reading... but I'm not sure where the sensor was! Indoors, I'm pretty sure, near where the light level sensor was, inside an east facing upstairs window. House was on downstairs thermostat- controlled heating, door open between thermostat and sensor. Can you see this in the data?! (^_^)
"Digression in digression"?...
One line in the spreadsheet reads...
25329i12 / 0 / 255 / 3 / 226 / 2102 / 3023
That record was...
- collected on 29 March, 2025, 12 minutes past the "i-th" hour, the first hour after midnight being the "a-th"
- from device 0... always thus in this dataset
- from sensor 255... always thus in this dataset
- (I forget what the 3 tells us!)
Now it get tricky, due to a flaw in the software harvesting the data...
- 226 is the first part of a temperature.
The rest of the temperature is the 2 at the start of the next number in the spreadsheet record. So the temperature is 2263, which represents + 22.63 degrees Celsius. (That 4th digit is probably meaningless. I wouldn't consider extracting it to complete all of what was sent in respect of temperature. But you have to know to "throw it away" when you start collecting the light level datum.)
- The last three digits of the 6th number are the START of the light level detected. Sigh. It is completed with the first digit of the next number. Thus, the light level in this record is 1023.
- I don't recall what the next three numbers in the spreadsheet tell us(!). The next number is the number of cycles the data harvesting program had completed at the time the record was recorded.
- All the rest in each line of the spreadsheet is derived from the foregoing, by the spreadsheet.
Apologies for that tangle. I can assure you it wasn't as much hassle for you to read about it as it was for me to figure it out and write it up.
Eclipse shown by temperature
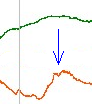
This is a graph from a completely separate system. The orange line (the lower one) show the day's outdoor temperature up to about 6pm. The vertical gray line was midnight. The blue arrow points to a dip in the temperature, for which the eclipse is the only candidate of which I am aware.
Few people I've spoken to noticed the "less bright" sunlight... even people who knew we were having an eclipse.
But there's a record of it in the dip in the temperature.
I can't explain the apparent slight RISE (above the trend) in the temperature shortly before the eclipse.
DO NOT LOOK DIRECTLY AT THE SUN... EVER!
... but that doesn't mean you can't "see" the eclipse the next time one occurs. Just....
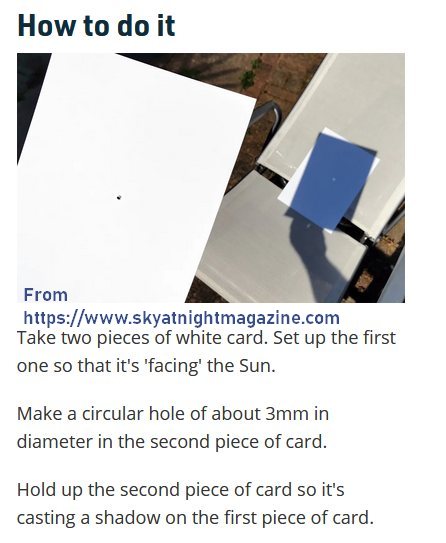
For the March 2025 eclipse, I did a very crude version, and got quite reasonable results. There were three holes in my card, hence three projected images of the sun.
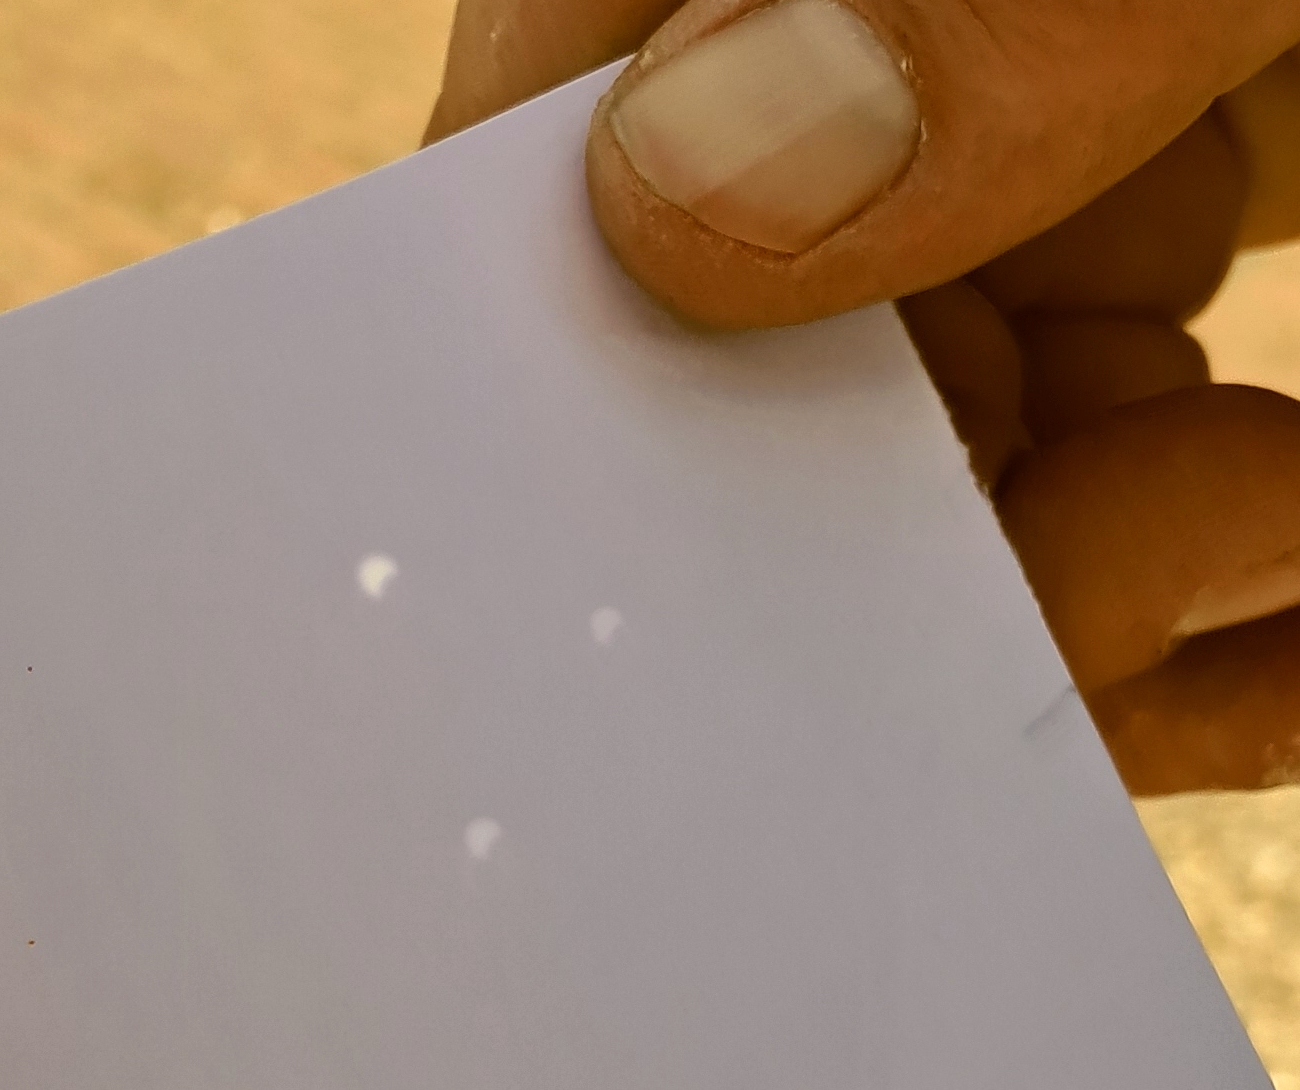

(The image to the left is a massaged enlargement of one of the images of the sun cast on my card. The result was better than this image suggests! I only took a crude, hasty photo of the image.)
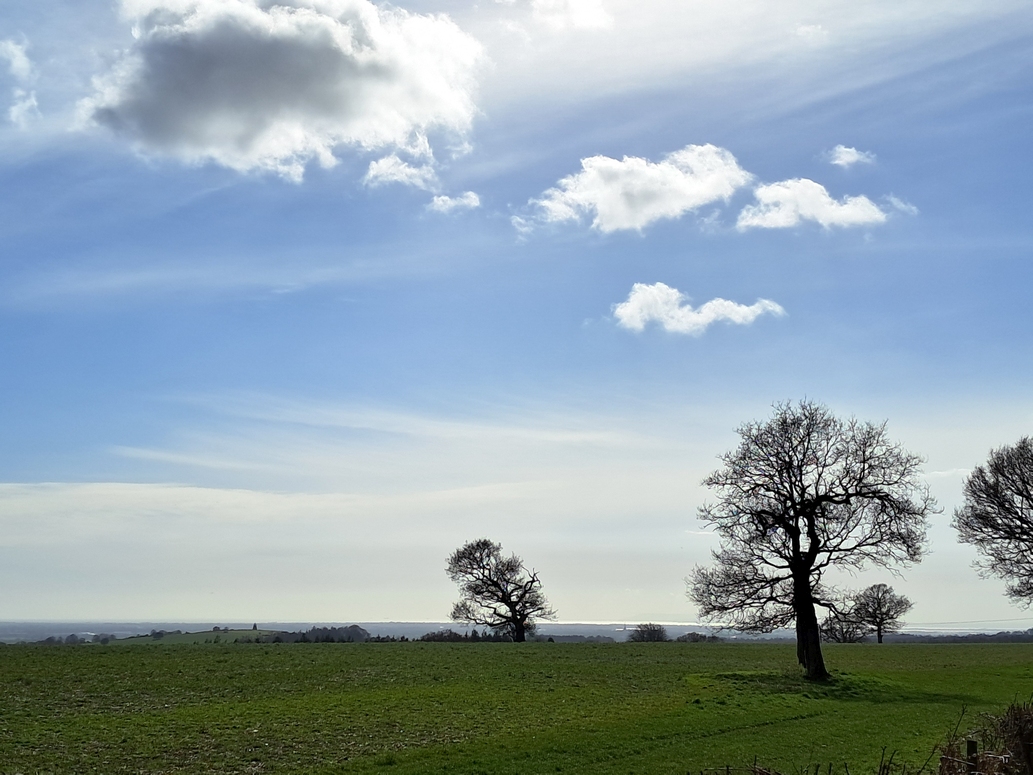
The photo at the left shows the weather on the day...
You can do it! / How I did it...
How the data was collected.
You could do something similar, but I have to warn you... there are a few "ingredients" to assemble.
First you need something with sensors which can serve web-pages. An Arduino is ideal. An Arduino "just" on a LAN will do.
Then you need to arrange for a line to appear in the page served by the Arduino, with the data from the sensors in a specific format.
Once you've got that, "only" that, the rest is easy! I am giving away the program which goes to the web server, fetches the page, extracts the data, and gives you a CSV file. (There are links from there to the "how to set up the Arduino" part.)
PLEASE... if you go and look, and think "that would be fun", even if you don't have time to try it yourself, spread the word? Making all of that (and this page, for that matter) was a lot of work. I begin to wonder if I should bother, given the amount of traffic that I get. But you've read this far... you must have enjoyed it at least a little bit. PLEASE TELL OTHERS! Facebook "like", mention....
https://flat-earth-academy.com/sci/astro/eclipse2025329.htm
... in a blog post. SOMETHING?
Odds, ends...
I had the very good fortune when about 11 years old to see a total eclipse, in good weather. Very memorable, of course.
Even with the good weather we had for the March 2025 eclipse, where I was it was only partial... about 30%... hardly noticeable, unless you knew how to "see" it.
The nice people at the Goddard Space Labs did some great, and not "ordinary" visualizations, which you can see, with narration, in this 60 second clip at YouTube..
Classic FM told me (3/20) that there have been 8 total eclipses in the UK (England?) in 500 years. Roll on 2090, when we can see another one in the UK. In the meantime... a good excuse for travel?
You can learn about upcoming eclipses, solar and lunar, worldwide, from www.TimeAndDate.com/eclipse. They lay everything out well, don't you think?
I hope the material above amused? If it did, you might also enjoy...
my account of seeing the 2012 transit of Venus
... or ...
my account of seeing the 2015 solar eclipse with the same sensors and software used to generate the page you are reading!
New! 3 Aug 26...
I have had quite a lesson in the costs of not doing things properly this afternoon.
Another eclipse is coming. (12 Aug 26). I wanted to be sure I was ready to record it... but when I went looking for how I did it last time, I could not find those details. I could not find this PAGE!!!!.
Sigh.
After a long and disconsolate search, I found this page. Hurrah!
But, as I half suspected, the "how I did it" information was not here.
So, better late than never, not that it will mean anything useful to you, for MY purposes...
The hardware used to capture the light level data:
   The "Arduserver 3" at NC on LIPA.240:81"
     (In 2025 I'd made an entry about that: "Does work!
        Not used for YEARS, tends to seize up,
        and did so at bad time 29 Mar 25")
The software used harvest readings from the
   Ardserver: a version of FW099.
Datafile massaged, graph ceated with LibreOffice.
The spreadsheet: VSQ424-SolarEclipse.ods
   (Copy on PCva25aug, 3 Aug 26)
For my attempt to record the 12 Aug 26 eclipse, I used the prgm and ini file in...
   (PCva25aug) Documents\Prgms\TKB-priv\fww009vers\
         fww009-25b16-1340 nc 240-81 solar
So. There you have it. At least, for once, I didn't attempt to set things up at the eleventh hour. Now all we need to do is pray for a clear sky. As we've had almost no rain here in southern England from 13 July (or earlier) until today (3 Aug 26), it is a bit perverse to pray for no rain. But that's only for the evening of the 12th. (Oh. And then there's: My broadband connection is scheduled for a massive upgrade/ overhaul/ router replacement, etc on the 11th. What could possibly go wrong?)
In 2025, there was a flaw in the formatting of the recorded data. There was nothing wrong with the version of FWW009... but there was a flaw in the ini file used.
At 3 Aug 26, it seems that the version then in "PCva25aug...Documents\Prgms\TKB-priv\fww009vers\fww009-25b16-1340 nc 240-81 solar", with the ini file it had is the way to go to get correctly formatted data.
Critcal lines in ini file...
[MainElements]
IPAddr=http://192.168.0.240:81
WhereFmtCodeLineIs=6
CodeForTypeOfDataSource=1
KludgeDeviceServed=Ardu3
Some may be contradictory! But the program will obey the one(s) we need it to for the Arduserver with the light level sensor.
Search across all my sites with the Google search button at the top of the page the link will take you to.
Or...
Site Map
What's New
Search
The search engine merely looks for the words you type, so....
- Spell them properly.
- Don't bother with "How do I get rich?" That will merely return pages with "how", "do", "I"....
I have other sites. My Google custom search button will include things from them....
One of my SheepdogGuides pages.
My WYWTK... "What You Want To Know"... site.
My site at Arunet.
Ad from page's editor: Yes.. I do enjoy compiling these things for you... I hope they are helpful. However.. this doesn't pay my bills!!! If you find this stuff useful please tell othersLinks on your page to this page, mentions in chats, etc, would be appreciated.
How to email or write this page's editor, Tom Boyd. Please cite "FEA... Eclipse2025329.htm".
 Page has been tested for compliance with INDUSTRY (not MS-only) standards, using the free, publicly accessible validator at validator.w3.org. It passes in some important ways, but still needs work to fully meet HTML 5 expectations. (Copy your page's URL to your clipboard before clicking on the icon, so you can easily paste it into the validator when it has loaded.)-->
AND it has been tested with...

 Why is there a script or hidden graphic on this page? I have my web-traffic monitored for me by eXTReMe tracker. They offer a free tracker. If you want to try one, check out their site. Neither my webpages nor my programs incorporate spyware, but if the page has Google tools, they also involve scripts. Why do I mention the scripts? Be sure you know all you need to about spyware.
-- Page ends --