 Bookmark this on Delicious
 Recommend to StumbleUpon
Sorry... this page needs a LOT of editing... for html, etc... not so much for the contents. The Lazarus code is done, working... it is just the write up that is faulty.
A compiled .exe is available so that you can play with the application without having to compile it. The Lazarus sourcecode is in the same zip file you can download. Both are there for you to play with... but I reserve all rights to any applications derived from the sourcecode. It is there to show you programming techniques, not to be the basis of a commercial product. Well... anyone else's commercial product, anyway.
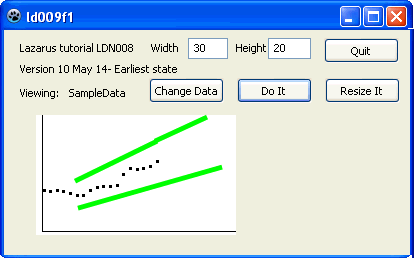
I hope you came to this web page after being enthralled by an earlier page which sets out how you might create an application to draw a small chart of stock prices on your computer's screen.
The result of that exercise looked something like this, minus the green lines)....
(I have made the data points larger, to make them easy to see. And remember: As the application stood at the end of the previous tutorial the green lines weren't present.
How We Draw The Green Lines is the point of this tutorial.
You could, of course, draw them many ways. My hope is to add code to the application that will make adding the lines, and moving them about, very intuitive.
They are supposed to indicate my guess as to the "boundaries" within which the stock "should" trade over the coming weeks. Once this program is done, I hope to create further programs, ones which will automatically "watch" the companies I've done "green line diagrams" for, and alert me when a company acts differently from my expectations.
But first, the green lines.
Now we are going to go on, and see how we can add a feature to the application created earlier. The user is going to be able to draw two lines on the diagrams it produces... roughly like the green lines above.
Not only will the user be able to draw those lines, but also easily move them. And the diagram can be reloaded easily... the parameters of the lines will be saved for future re-drawing. I discussed the "why" of this a bit more in the start of the first page.
There are many ways the green lines could be defined. The diagram below, and the text following it are meant to explain the approach I've taken...
The graph's X axis is date; the Y axis is for the price of a stock, but could of course track many other things.
To define the two green lines, I will pick two dates, D1 and D2, indicated by the two vertical blue lines.
Each of the green lines crosses the blue lines. I've marked the four points concerned: "1", "2", "3", and "4".
By the way... all of the lines, and the data points, will be less "clunky" in the finished application ... I just didn't want you squinting to read the diagrams!
We're going to be able to do two things: Eventually we'll be able to move the blue lines left and right. (That is being provided for in the way this is written, but not implemented in this tutorial.) And we are going to be able to "grab" the green lines at the placed they cross the blue lines, and drag those points up and down, thus moving the lines.
Well. That's the plan. We'll have to see how it goes. Less elegant answers may have to suffice, and we will probably get to the "final" answer by way of some less elegant initial answers.
This tutorial is very heavily rooted in the one that comes before it, LT3Nf-1.htm. We are "merely" extending the application built in that tutorial.
We will get the blue lines "working" first, then add the green lines. Then do the programming which will allow the diagram to be saved for future use. When the diagram is called up subsequently, if the datafile with date/price records has been updated, we will see our old diagram, but with the new data also present.
First we'll write a subroutine to draw a vertical blue line.
For the moment, we will have two buttons... a "DrawLeft" button and a "DrawRight" button. For the moment, we will only draw the blue lines in two hardcoded places. This is any more than a crude start to get certain things out of the way. It may seem that I make a meal out of what could be two lineto/moveto exercises. The reason for all the complexity is to build a flexible tool.
Obviously, we will use one subroutine, I'm calling it BlueLine. (A poor choice! (Someday I may want the a different color, and the name will seem odd. Oh well.) BlueLine has just one parameter, the X value for where you want the blue line. The date is expressed in the same units as the raw "date" data of the data file we are graphing. In that file, dates are held as data of type word... 16 bit unsigned integers. 16 May 2014 was 41775 in the system I'm using. That's the number that Lazarus (and many other programs) uses for that date. 17 May 2014 was 41776, and so on. OpenOffice Calc, and thus I would guess Excel, etc, use the same convention. Under it, Day 1 was December 31 1899.
(A sidenote: Lazarus (and the rest) are some way from their Y2K event. Although I'm putting the dates in this program into word-type variables, leading to a Y2K event on June 4th, 2079, Lazarus uses double-type variables for date/times... they use 8 bytes to store numbers up to 1.7x 10 to the power 308, with 15 to 16 significant decimal places! (That won't be on the test on Friday.) End sidenote.)
In order to make the blue lines resize and relocate nicely when, for instance we change the scale, we are going to be using values from many variables which were explained in part one of this two part tutorial. We will introduce two more variables which will control the vertical extent of the blue lines. (bLineBottPercent,bLineTopPercent:byte;)
A very, VERY basic "prototype "BlueLine" is as follows...
procedure Tld009f1.BlueLine(wX:word;);
begin
Image1.Picture.Bitmap.canvas.pen.color:=clBlue;
Image1.Picture.Bitmap.canvas.moveto(wX,10);
Image1.Picture.Bitmap.canvas.lineto(wX,40);
end;//DrawBlue
That draws a vertical blue line... but not in the right place! Here's the same code, but using various things we developed earlier to put the line where it should be. (If our graph is currently drawing with the X axis running from, say, 41710 to 41750, then calling BlueLine(41730) would do the blue line half way across the X axis. Fear not! Users will never see the arcane date values, unless they go into the data file (to be created later) with a text editor.
I need to remind you of a term we developed in the first tutorial, perhaps: The "GraphArea" is that part of the whole bitmap which is above and to the left of the axes we've drawn for the graph (chart) of prices.
Previously, the 10 and 40 in the moveto and lineto made the line draw from row 10 to row 40 of the entire bitmap the graph is drawn on. (10 and 40 down from the top.) Now they cause the blue line to go from 10% up from the bottom of the GraphArea to 40% of the way up the GraphArea.
procedure Tld009f1.BlueLine(wX:word;boDraw:boolean);
//Set boDraw true to draw the line, false to erase it
//This can almost certainly be made to run more quickly
//  by pre-calculating elsewhere the Y values for the
//  ends of the blue line
var bLineBottPercent,bLineTopPercent:byte;
    iLineBottBitmap, iLineTopBitmap:integer;//The Y coords, in
    //"bitmap" units, for top and bottom of the line.
begin
bLineBottPercent:=10;// Set these to 10 and 40
bLineTopPercent:=40;//  respectively, and the blue line
//  will run from 10 percent up the GraphArea to 40
//  percent up the GraphArea

//Figure out where the bottom of the line will be
siTmp:=(wGrGAHeight*bLineBottPercent)/100;
iLineBottBitmap:=wGrGAHeight-trunc(siTmp);

//Figure out where the top of the line will be
siTmp:=(wGrGAHeight*(100-bLineTopPercent))/100;
iLineTopBitmap:=trunc(siTmp);

Image1.Picture.Bitmap.canvas.pen.mode:=pmXor;
Image1.Picture.Bitmap.canvas.pen.color:=(clBlue XOR clWhite);

Image1.Picture.Bitmap.canvas.moveto(iGAtoBitmapX(iRawToGAX(wX)),
                 iLineBottBitmap);
Image1.Picture.Bitmap.canvas.lineto(iGAtoBitmapX(iRawToGAX(wX)),
                 iLineTopBitmap);

Image1.Picture.Bitmap.canvas.pen.mode:=pmCopy;
end;//DrawBlue
That got a little "cluttered", but much of it can be moved out. We're still "just" doing a moveto followed by a lineto. Try to get yourself in agreement with that statement before going on. If you notice the XOR, ignore it for the moment.
Okay. You see that the above is mostly just a moveto/ lineto?
What's....
Image1.Picture.Bitmap.canvas.pen.mode:=pmXor;
Image1.Picture.Bitmap.canvas.pen.color:=(clBlue XOR clWhite);
... all about? It replaced....
Image1.Picture.Bitmap.canvas.pen.color:=(clBlue XOR clWhite);
Previously we were using the default pen mode. (I think that's pmCopy, as you can see by the statement at the end of BlueLine to restore drawing to "normal").
That's like drawing with a pen with very good ink. If the line you are making crosses anything, the thing underneath your line is lost, covered up by the ink you just laid down....
{{INSERT DIAGRAM OF DRAW WITH pmCopy}}
If you "draw" on a computer, fancier things become possible.
In the context of our project, consider the following...
What if we've already plotted the prices data before we draw the blue lines. And then we draw the blue lines using pmCopy. Any date/price datapoint which lies on a pixel the line goes through is lost. Probably not the end of the world, but still regrettable.
If we draw in pen mode pmXOR, however, something rather magic happens.
If we set the pen's color to (clWhite XOR clBlue), then anywhere we are drawing on white, we get a blue pixel. But if, perchance, our line crosses over something that isn't white, we'll get some other color. Not blue. Not white. So the "BlueLine" will be entire... it just won't all be blue. But the place we crossed over something will still be "special", and, for instance, previously drawn data points won't be lost.
Now... so far so good... but you need to know something else. It won't be of a lot of use... yet... but we will use it shortly.
If you draw a line once, as described above, it will do what I said. If you drew across mostly white areas, you will have a mostly blue line. What happens if you leave everything as it was when you drew the line, and "draw it" again? It will disappear! The bits that were blue will go back to white. The bits which changed to some other color when you drew, in pmXor mode, over them with "color" "(clWhite XOR clBlue)" will go back to what they were previously. Magic!
So, if you have been following along, and made the application I've described, and you have the Draw Left and Draw Right buttons, go ahead and click them ONCE, and you'll see the expected blue line. Click them again, and the blue line goes away. Click them a third time, and they come back again.
Now... we don't really want them coming and going, so we will arrange to have the procedures to draw them called only once. But in a moment, you're going to see XOR help us enormously.
Why not just draw in pen mode pmCopy. You could. Do that, if the XOR thing... for the blue lines... is giving you a headache. But XOR is good even for the blue lines because, as I said, you don't lose datapoints which would otherwise disappear.
Leave the buttons. We will recycle them for other purposes in a moment. Move the calls of Blue Line to the current end of the DrawGraph procedure.
Put...
bLineBottPercent:=10;
bLineTopPercent:=80;
... in the FormCreate handler.
We could "get clever" and move a few bits of the BlueLine procedure into the latter part of ChangeDataStep2, but that would make it harder to see what is going on, and I don't think you'd see the difference in performance to make that worth doing.
First we'll write a subroutine to draw green line. It would be simpler (for us) to give the procedure the two endpoints using the units the data is stored in... but we may need to maximize the drawing speed of this. .. so we will write the procedure so that it gets the coordinates in the units used by moveto and lineto, the "bitmap coordinates". (We can always set up a separate procedure to convert from the units the data is stored in to the bitmap coordinates, later, if we want that. Or maybe we'll only need to be able to go from bitmap coordinates to data coordinates, anyway.)
For the moment, we won't worry too much about WHERE the green line draws. We'll just make sure to draw it SOMEWHERE on the bitmap.
Before you go on: Change the default dimensions of the image and the bitmap to 200 and 120. (You this with the iImageWidth:= and iImageHeight:= lines in the FormCreate handler.)
All we need is the following, and revise buDrawBlueLeft so that it becomes...
GreenLine(30,30,100,30);
(Rename and re-label the component, if you wish.)
The GreenLine procedure is as follows...
procedure Tld009f1.GreenLine(iX1,iY1,iX2,iY2:integer);
//Parameters expressed in the units used by the bitmap.
//Remember: Draws TO, but not including, iX2,iY2
begin
  Image1.Picture.Bitmap.canvas.pen.mode:=pmXor;
  Image1.Picture.Bitmap.canvas.pen.color:=(clGreen XOR clWhite);//changes
        //white to green and visa versa when line drawn, etc.

Image1.Picture.Bitmap.canvas.moveto(iX1,iY1);
Image1.Picture.Bitmap.canvas.lineto(iX2,iY2);

Image1.Picture.Bitmap.canvas.pen.mode:=pmCopy;
end;
With the above, if you click on our re-purposed "Draw Left" button, ONCE, you should get a horizontal green line. Click it again, and it goes away. You can click the button more that twice, to see the green line appear and disappear.
Now change the code called by the button to...
procedure Tld009f1.buDrawBlueLeftClick(Sender: TObject);
    procedure ShortPause;//NOT a good technique, but for a
      //short pause, probably not TOO bad...
      var dtThen,dtTarget:TDateTime;
      begin
       dtThen:=now;
       dtTarget:=Now+0.000007;
         repeat
           //do nothing;
         until now>dtTarget;//This will "hang up" once in a very long time.
      end; //ShortPause

begin //buDrawBlueLeftClick (re-purposed)
  GreenLine(10,10,40,10);
  ShortPause;
  Image1.repaint;
  GreenLine(10,10,40,10);
  GreenLine(9,9,42,12);
  ShortPause;
  Image1.repaint;
  GreenLine(9,9,42,12);
  GreenLine(7,7,46,16);
  ShortPause;
  Image1.repaint;
  GreenLine(7,7,46,16);
  GreenLine(7,7,52,22);
  ShortPause;
  Image1.repaint;
  GreenLine(7,7,52,22);
  GreenLine(5,5,58,28);


end;
(Note my warning: The code creating the short pause is dreadful. It will not be part of any finished application.)
That code....
Draws a horizontal line.
Pauses a moment.
Draws "the same line"... in mode pmXor, so it disappears
Draws a line slightly twisted from horizontal
Pauses a moment.
Draws "the same line"... in mode pmXor, so it disappears
Draws a line even more twisted from horizontal...

... etc.
The user sees a series of lines; the user sees the green line "moving". And programming it is made much simpler by the power of pen mode pmXor.
I hope this will seem "simple" to you, being brilliantly explained, and all that. If you like a challenge, try getting to make it work yourself, from scratch. The basic idea is simple. you might want to try the exercise in isolation, in a new application which just demonstrates the variable length line.
"All" we're going to do in this example of using XOR drawing is...
Have a form with a horizontal green line on it which stretches from bitmap coordinates (10,20) to someplace between (50,20) and (180,20). How far will depend on the position of the scrollbar's "thumb" (the little slidey bit.
Put a scrollbar on a form. (They're on the "Standard" tab of the component palette.) Make it horizontal.
Leave its name "ScrollBar1". Set "Min" to 50 and "Max" to 180. If you are new to scrollbars, put a label called Label1 on the form.
Write a handler for the scrollbar's "Scroll" event. It should...
Hint: Getting things STARTED is half the battle. If you can "bring the form up" with the right things in the right places, half of your work is done.
Hint: You'll set the Scrollbar's Min and Max by hand, with the Object Inspector. (Or with assignments, very early in the FormCreate handler.) Somewhere, early in the application's execution, you'll want...
Scrollbar1.position:=Scrollbar1.min+(trunc((Scrollbar1.max-Scrollbar1.min)/2));
Hint: Get things set up right, and the heart of the Scroll event handler is just two moveto/lineto statements.
There! That's the challenge. Don't read more, until you've had as much fun with it as you wish to.
INSERT ANTI-SPOILER GAP
Make the Scrollbar's OnScroll handler...
procedure Tld009f1.ScrollBar1Scroll(Sender: TObject; ScrollCode: TScrollCode;
  var ScrollPos: Integer);
begin
  iTmp:=ScrollBar1.position;
  label1.caption:=inttostr(iTmp);
  //Overdraw old, erasing it, draw new...
      GreenLine(10,20,iPrevX,20);
      GreenLine(10,20,iTmp,20);
      iPrevX:=iTmp;
end;//ScrollBar1Scroll
That's "the heart" taken care of.
(I'm probably being inefficient in accessing ScrollBar1.position. I suspect the number in ScrollPos would be the same. For now, what I have WORKS...)
The tricky bit, once you've realized that the heart is that simple, is getting things off to the right start. In our bigger project, with the option of resizing things, an need to draw and to move both ends of the green lines, etc, etc, things get a bit "tricky", but even at their heart, "all" we need is...
For the line to be STARTED for us, with ONE call of GreenLine (in other words, one moveto/lineto).
Before we draw that, we need the scrollbar's thumb to be where we want it as a starting position. We need to draw the first line to go to where scrollbar.position says it should be. We need that number in iPrevX.
That's it for setup. We've already seen the code for the Scroll event handler. All that remains is to note that you must not call Greenline elsewhere, unless you call it a multiple of two times, duplicating the erase/redraw sequence seen in the Scroll event handler, and keep iPrevX up to date.
"All" we want for out stock market price watching program is a way to draw and "move" (erase/redraw) two lines, with both coordinates at both ends of both lines movable... although for now, the X coordinates won't change often, even though we want to be ABLE to change the X coordinates once in a while, and reserve the option of making them more changeable for future developments.
No problem! We've DONE the hard parts.
Now... a little "aside" about using arrays...
Arrays are a wonderful thing. Suppose you have a weather monitoring system, as I do. It is going to have multiple channels... indoor tture, outdoor tture, rainfall, etc.
And you'll have a graph, and use a different color to display the data for each channel.
I hear arrays calling! There will be an array called clColorDisp, and clColorDisp[0] will hold the color for displaying whatever channel 0 tracks, clColorDisp[1] will hold the color for displaying whatever channel 1 tracks, etc.
But! How many channels do you need? How big should that array (and all the others... bSensorType[], sGraphLabel[], etc, etc) be? When something like this is open ended, it always causes trouble.
Happily, for our stock market prices program, we really do need JUST TWO green lines. So it makes sense to set up one or more arrays to hold, for instance, the coordinates of the endpoints. Each array will have just two elements. Thingie[0] and Thingie[1]
Now... We COULD set up four arrays... one for the X of the first line, one for the Y of the first line, and two more for the X and Y of the other line.
However, we're going to use the power of a user defined "type" to squash all of that into a single array.
(If you want a gentle introduction to this, see my Delphi tutorial about user defined types, or records.)
Just before the....
type

  { Tld009f1 }
At the start of the program's code, insert...
type TLD009FourCoords = record //no ; here
  x1,y1,x2,y2:integer;
  end;//of declaration of type TLD009FourCoords
That creates a new data type. In any variable of type TLD009FourCoords, we can store four integers. We'll see how in a moment.
Now that we have created a new type, we're going to jump straight to using an array of memory elements of that type. So, in the usual variable declaration area, insert...
iGreenLineEnds:array [0..1] of TLD009FourCoords;
Good!
Just to "exercise" what we have, at the end of DrawGraph, temporarily insert the very crude, but transparent....
 iGreenLineEnds[0].x1:=10;;
 iGreenLineEnds[0].y1:=50;;
 iGreenLineEnds[0].x2:=100;;
 iGreenLineEnds[0].y2:=5;

 iGreenLineEnds[1].x1:=20;;
 iGreenLineEnds[1].y1:=50;;
 iGreenLineEnds[1].x2:=110;;
 iGreenLineEnds[1].y2:=5;

 GreenLine(
    iGreenLineEnds[0].x1,iGreenLineEnds[0].y1,
    iGreenLineEnds[0].x2,iGreenLineEnds[0].y2);

 GreenLine(
    iGreenLineEnds[1].x1,iGreenLineEnds[1].y1,
    iGreenLineEnds[1].x2,iGreenLineEnds[1].y2);
(That, if you got it right, draws two diagonal green lines as soon as DrawGraph is executed, as long as your bitmap is already at least 110 wide, 55 high.)
Remember: You can only call it once, because on a second call, as we are drawing in pmXor, we will "un-draw" it. But this was just a little thing to introduce the array iGreenLineEnds, with its way to store four coordinates per array element.
Now something simple: Create a little subroutine to fill an element of iGreenLineEnds. With the subroutine (I'll list the code in a moment) in place, all you need to do is...
FillCoords(1,20,50,110,5);
...to, in effect, do....
 iGreenLineEnds[1].x1:=20;;
 iGreenLineEnds[1].y1:=50;;
 iGreenLineEnds[1].x2:=110;;
 iGreenLineEnds[1].y2:=5;
The subroutine is, of course, merely....
procedure Tld009f1.FillCoords(bWhich:byte;iL0,iL1,iL2,iL3:integer);
begin
 iGreenLineEnds[bWhich].x1:=il0;;
 iGreenLineEnds[bWhich].y1:=il1;;
 iGreenLineEnds[bWhich].x2:=il2;;
 iGreenLineEnds[bWhich].y2:=il3;
end;
Whew! These somewhat abstract things can be challenging. Happily, we now return to the practical.
I'm going to leave to your imagination some of the "integrating" of these new ideas and tools and subroutines into our growing app. I'll do another full listing in a moment.
What will be in that is something that has the two green lines on a graph of stock prices which we have been talking about. The "Do it" button is gone... the graph draws, including some green (and blue) lines, when appropriate. Resizing works. (Maintaining the position of the green lines between resizes was "interesting". The resizing mechanism remains crude, but it has been written in a manner which will, I hope, one day allow for simple dragging for resize. (The window can be resized by dragging, but not the graph. For that, you enter your wishes, click a "Resize" button.)
While the old "Change Data" button will remain... we will need it eventually... the application will launch with a default set of data in place. (For now, the change data will do the things it will eventually need to do... apart from actually switching to a different data set!)
The Draw Right and Draw Left buttons will have gone, as they were only for testing little odds and ends.
This whole thing is taking many, MANY more days than I had available for it.
While my dream of one day being able to adjust the position of the green lines simply by dragging the places they cross the blue lines remains alive, it has been, for now, been put on a back burner. Instead, for now, I will have four scrollbars... one for each blue line/ green line intersection. And I will continue to develop the program with a view to one day converting the user interface to the drag-with-mouse alternative.
To that end, the first scrollbar will be re-named sbUpperRight. And three more have been added... sbLowerRight, sbUpperLeft, sbLowerLeft.... all with their own associated variables, initializations, etc, etc. Sigh.
This is the code for the application, for what we have done so far...
unit LD009u1;

//Two pressing "to dos" explained in lines starting "qtodo"

{$mode objfpc}{$H+}

interface

uses
  Classes, SysUtils, FileUtil, Forms, Controls, Graphics, Dialogs, StdCtrls,
  ExtCtrls;

const vers='18 May 14- Now does the two green lines. Does not save yet';
  //Extension of LD008... a graph drawing application. In this form,
  //   it draws its data from a constant, sDataSource.


sDataSource='41746-2300/41745-2280/'+
  '41744-2270/41743-2265/41742-2270/'+
  '41741-2245/41740-2198/41739-2196/41738-2195/41737-2190/41736-2180/'+
  '41735-2155/41734-2158/41733-2165/41732-2175/41731-2180/41730-2175/'+
  '41729-2180/41728-2175/41727-2180/9999-1000/0000-1000';


type TLD009FourCoords = record //no ; here
  x1,y1,x2,y2:integer;
  end;//of declaration of type TLD009FourCoords

type
  { Tld009f1 }
  Tld009f1 = class(TForm)
    buQuit: TButton;
    buResizeIt: TButton;
    buChangeData: TButton;
    Edit1: TEdit;
    eWidth: TEdit;
    eHeight: TEdit;
    Image1: TImage;
    laAppInfo: TLabel;
    Label1: TLabel;
    laTxtDoChangeDataFirst: TLabel;
    laTxtDataSet: TLabel;
    laDataSet: TLabel;
    laTxtWidth: TLabel;
    laTxtHeight: TLabel;
    laVer: TLabel;
    sbUpperRight: TScrollBar;
    sbUpperLeft: TScrollBar;
    sbLowerLeft: TScrollBar;
    sbLowerRight: TScrollBar;
    procedure buChangeDataClick(Sender: TObject);
    procedure buQuitClick(Sender: TObject);
    procedure buResizeItClick(Sender: TObject);
    procedure eWidthChange(Sender: TObject);
    procedure FormCreate(Sender: TObject);
    procedure sbUpperLeftScroll(Sender: TObject; ScrollCode: TScrollCode;
      var ScrollPos: Integer);
    procedure sbUpperRightScroll(Sender: TObject; ScrollCode: TScrollCode;
      var ScrollPos: Integer);
    procedure sbLowerLeftScroll(Sender: TObject; ScrollCode: TScrollCode;
      var ScrollPos: Integer);
    procedure sbLowerRightScroll(Sender: TObject; ScrollCode: TScrollCode;
      var ScrollPos: Integer);
    procedure LayDownGreenLine;
    procedure FillCoords(bWhich:byte;iL0,iL1,iL2,iL3:integer);
    function bPosnAsPercentY(iTmpL:integer):byte;
  private
    { private declarations }
    Bitmap:TBitmap;
    liScYOffset,liPrice:longint;//-2x10^9 to +2x10^9, smallest able to hold
    //the numbers I may present for price-in-pennies. (word can only cope
    //with up to $655.35, (in pennies: 65535)
    iTmp,iImageLeft, iImageTop, iImageWidth, iImageHeight:integer;
    bGrAxWidX,bGrAxWidY:byte;
    wGrMarBott,wGrMarLeft,
    wGrGAWidth,wGrGAHeight,wGrGAWidthPrev,wGrGAHeightPrev,
    wOldestToDisplay,wWhereInData,wDate:word;
    //Dates are held inside this program using the usual Lazarus, and others,
    //convention which made 16 May 2014 41775. 17 May 2014 was 41776, and so on.
    //OpenOffice Calc, and thus I would guess Excel, etc, use the same convention.
    //Under it, Day 1 was December 31 1899
    iScXOffset,iGrBelowDataCloudGap:integer;
    sTmp,sDataSet:string;
    wXMaxRaw, wXMinRaw:word;
    liTmp,liTmp2,liYMaxRaw,liYMinRaw,liGrGAMin:longint;
    wScXOffset:word;
    siTmp,siScXStretch,siScYStretch:single;
    bLineBottPercent,bLineTopPercent:byte;
    iGreenLineEnds:array [0..1] of TLD009FourCoords;
    iPrevX,iPrevY:array[0..3] of integer;
    bYStart:array[0..3] of byte;
    //The start positions, y coords of, the four places
    //  green lines cross blue lines, expressed as percents
    //  of whole Y dimension of graph area. N.B. bitmaps and
    //  scrollbars count from 0 at the top, so "10" means
    //  10 percent DOWN from top of graph area.
    //Element 0 for upper left, 1 for upper right,
    //  2 for lower left, 3 for lower right... i.e., as you
    //  would read text.
    //Init'd in FormCreate, eventually to appear in ini file
    //  for the stock in question.
    //these values are of very limited interest they define
    //  the default positions of the GreenLines for a company
    //  which hasn't previously had a GreenLine diagram.
    //Where the green lines are after they've been "started",
    //  which varies from company to company, and will
    //  be sorted in a company specific "ini" file, very soon
    //  become the responsibility of iPrevY[x].

    procedure EstablishBitmap;
    procedure DrawGraph;
    function iBitMapFrmHumY(iConvert:integer):integer;
    procedure DrawXAxis;
    procedure DrawYAxis;
    procedure MoveLineToAndInclude(iX1,iY1,iX2,iY2:integer);
    procedure PlotDataPoint(wX:word;liY:longint);
    procedure ChangeDataStep1;
    procedure ChangeDataStep2;
    function iRawToGAX(wConvert:word):integer;
    function iRawToGAY(liConvert:longint):integer;
    function iGAtoBitmapX(iConvert:integer):integer;
    function iGAtoBitmapY(iConvert:integer):integer;
    procedure ReadRecord(var w1:word;var li1:longint);
    procedure BlueLine(wX:word);
    procedure GreenLine(iX1,iY1,iX2,iY2:integer);
  public
    { public declarations }
    end;

var
  ld009f1: Tld009f1;

implementation

{$R *.lfm}
{$R+}//Enable range checking

{ Tld009f1 }

procedure Tld009f1.FormCreate(Sender: TObject);
begin
  laVer.caption:='Version '+vers;

  //Variables related to the TImage object...
  //See https://sheepdogguides.com/lut/lt1Graphics.htm for details
  //  of using a bitmap as a drawing surface to work with...

  iImageLeft:=60;//Set initial values for core variables
  iImageTop:=120;
  iImageWidth:=200;
  iImageHeight:=105;

  bGrAxWidX:=1;
  bGrAxWidY:=1;

  wGrMarBott:=4;
  wGrMarLeft:=6;

  bLineBottPercent:=10;// Set these to 10 and 40
  bLineTopPercent:=80;//  respectively, and the blue line
  //  will run from 10 percent up the GraphArea to 40
  //  percent up the GraphArea

  //Establish first "Previous" values. "Current" will be set
  //  in a more relevant place.
  //Can, in FormCreate, use these as "current"

  wGrGAWidthPrev:=iImageWidth-wGrMarLeft-bGrAxWidY;
  wGrGAHeightPrev:=iImageHeight-wGrMarBott-bGrAxWidX;

  //bYStart: Has a SMALL role
  bYStart[0]:=40;//Percents of whole. See notes where array declared.
  bYStart[1]:=10;
  bYStart[2]:=60;
  bYStart[3]:=50;

  iPrevY[0]:=trunc(wGrGAHeightPrev*bYStart[0]/100);
  iPrevY[1]:=trunc(wGrGAHeightPrev*bYStart[1]/100);
  iPrevY[2]:=trunc(wGrGAHeightPrev*bYStart[2]/100);
  iPrevY[3]:=trunc(wGrGAHeightPrev*bYStart[3]/100);


  //Set Scrollbar.postions accordingly, as lines draw from these
  //   initially (at least)

  sbUpperLeft.position:=iPrevY[0];
  sbUpperRight.position:=iPrevY[1];
  sbLowerLeft.position:=iPrevY[2];
  sbLowerRight.position:=iPrevY[3];

  ChangeDataStep1;//Must happen BEFORE EstablishBitMap can occur
  EstablishBitmap;//Must happen AFTER core variables have values
  //ChangeDataStep2;Is done during EstablishBitMap

  DrawGraph;

end;// of FormCreate

procedure Tld009f1.EstablishBitmap;
//A purist would pass things like iImageWidth to this procedure
//   as parameters. I am "breaking the rule" deliberately,
//   judging the value, here, not worth the nuisance.
//Besides Establishing the bitmap, this routine changes the
//   values in some variables referred to elsewhere when
//   scaling things to fit graph well.

var siHori,siVert:single;

begin  //EstablishBitmap

  Image1.left:=iImageLeft;//Set size and posn of TImage control
  Image1.top:=iImageTop;
  Image1.width:=iImageWidth;
  Image1.height:=iImageHeight;

  Bitmap:=TBitmap.create;//Create a bitmap object

  Bitmap.width:=iImageWidth;//Adjust dimensions
  Bitmap.height:=iImageHeight;

  //In Delphi, bitmap background is white to begin with. Black in Lazarus
  Bitmap.canvas.pen.color:=clWhite;//1 of 2 lines not needed in Delphi...
  Bitmap.canvas.Rectangle(0,0,iImageWidth,iImageHeight);//2 of 2 not needed, Delphi

  //... continue EstablishBitmap....
  Image1.Picture.Graphic:=Bitmap; //Assign the bitmap to the image component
  //Note how we have adjusted the size of the image to the size of the bitmap
  //   we will be assigning to it.

  //Now fill two variables with values for the width and height of the
  //  "Graph Area", i.e. that part of the bitmap to the left of, and
  //  above the two axes.
  //If there are 15 rows of pixels and and 25 columns of pixels in the
  //  Graph Area, then you would set wGrGAWidth:=15, wGrGAHeight:=25

  wGrGAWidth:=iImageWidth-wGrMarLeft-bGrAxWidY;
  wGrGAHeight:=iImageHeight-wGrMarBott-bGrAxWidX;

  //... continue EstablishBitmap....

  //ARE YOU SURE THIS IS PLACE FOR THESE???
  //Seems to work... but not carefully thought out.
  //If it doesn't work... is the the placement of these,
  //  or how they are used? or how things are done
  //  elsewhere?...
  sbUpperLeft.max:=wGrGAHeight;
  sbUpperLeft.min:=0;
  sbLowerLeft.max:=wGrGAHeight;
  sbLowerLeft.min:=0;
  sbUpperRight.max:=wGrGAHeight;
  sbUpperRight.min:=0;
  sbLowerRight.max:=wGrGAHeight;
  sbLowerRight.min:=0;

 //... continue EstablishBitmap....
 siVert:=wGrGAHeight/wGrGAHeightPrev; //Adjustment factor, to take us across Resize

 iPrevY[0]:=trunc(iPrevY[0]*siVert);
 iPrevY[1]:=trunc(iPrevY[1]*siVert);
 iPrevY[2]:=trunc(iPrevY[2]*siVert);
 iPrevY[3]:=trunc(iPrevY[3]*siVert);

 Label1.caption:='';
 iTmp:=iPrevY[0];//Bitmap AND scrollbar: min at TOP, max at bottom
 sbUpperLeft.position:=iTmp;

 iTmp:=iPrevY[1];
 sbUpperRight.position:=iTmp;

 iTmp:=iPrevY[2];
 sbLowerLeft.position:=iTmp;

 iTmp:=iPrevY[3];
 sbLowerRight.position:=iTmp;

  //Record these for use across next resize event
  wGrGAHeightPrev:=wGrGAHeight;
  wGrGAWidthPrev:=wGrGAWidth;

  //At this point, ChangeDataStep2 must be called to recalc the scaling
  //  factors, but ChangeDataStep1 doesn't need to be called every
  //  time we are doing EstablishBitmap because sometimes
  //  we are still dealing with the same data, and any data changing
  //  or assessing the range of values in the data takes place in Pt1
  ChangeDataStep2;

end; // of EstablishBitmap

procedure Tld009f1.buResizeItClick(Sender: TObject);
begin
  Bitmap.destroy;

  iImageWidth:=strtoint(eWidth.text);
  iImageHeight:=strtoint(eHeight.text);

  //ChangeDataStep1 not needed JUST to resize.
  EstablishBitmap;
  //ChangeDataStep2; This happens inside EstablishBitmap.
  DrawGraph;
end;

procedure Tld009f1.eWidthChange(Sender: TObject);
begin

end;

procedure Tld009f1.PlotDataPoint(wX:word;liY:longint);
//This procedure does access external "constants" as well.
//X was put in a word-type variable, and Y in a longint
//   because of the data anticipated in the specific
//   application this was written for. (Word wasn't big
//   enough for some of the Y data.)
var iTmpXL,iTmpYL:integer;
begin
  iTmpXL:=iGAtoBitmapX(iRawToGAX(wX));
  iTmpYL:=iGAtoBitmapY(iRawToGAY(liY));
  Image1.Picture.Bitmap.canvas.pixels
    [iTmpXL,iTmpYL]:=Image1.Picture.Bitmap.canvas.pen.color;
end;//of PlotDataPoint

procedure Tld009f1.DrawGraph;
begin
 Image1.Picture.Bitmap.canvas.pen.color:=clBlack;

 DrawXAxis;
 DrawYAxis;

 //Connect to data stream
 wWhereInData:=1;

 //Datastream is already validated... happened back in
 //  ChangeDataStep1 before max/mins found

 ReadRecord(wDate,liPrice);
 repeat
   PlotDataPoint(wDate,liPrice);
   ReadRecord(wDate,liPrice);
 until {out of data or}wDate<wOldestToDisplay;

 //Release connection to datastream will go here, when one needed

 // ... continue DrawGraph ....

 BlueLine(41730);//Need to make fancier, tie to x1, x2.
 BlueLine(41750);

//Put GreenLines in start posns... later use values from ini file... indirectly?

//gtodo THEN... get x's on blue lines (which will mean first locating blue lines with variables)

iTmp:=sbUpperRight.position;

//The "10" and "90" need to go into globals.... (space, left and right, around GreenLine)
//In fact, a function is needed... something very like...
//   wGrMarLeft+bGrAxWidX+trunc(wGrGAWidth*10/100)
//   ... turns up in too many places. (The 10 is, at present, sometimes a 90)
FillCoords(0,wGrMarLeft+bGrAxWidX+trunc(wGrGAWidth*10/100),
   iPrevY[0],wGrMarLeft+bGrAxWidX+trunc(wGrGAWidth*90/100),iTmp);
FillCoords(1,wGrMarLeft+bGrAxWidX+trunc(wGrGAWidth*10/100),
   iPrevY[2],wGrMarLeft+bGrAxWidX+trunc(wGrGAWidth*90/100),iPrevY[3]);

GreenLine(
    iGreenLineEnds[0].x1,iGreenLineEnds[0].y1,
    iGreenLineEnds[0].x2,iGreenLineEnds[0].y2);
    iPrevY[1]:=iGreenLineEnds[0].y2;

GreenLine(
    iGreenLineEnds[1].x1,iGreenLineEnds[1].y1,
    iGreenLineEnds[1].x2,iGreenLineEnds[1].y2);

end;//of DrawGraph

procedure Tld009f1.FillCoords(bWhich:byte;iL0,iL1,iL2,iL3:integer);
begin
 iGreenLineEnds[bWhich].x1:=il0;;
 iGreenLineEnds[bWhich].y1:=il1;;
 iGreenLineEnds[bWhich].x2:=il2;;
 iGreenLineEnds[bWhich].y2:=il3;
end;

//======
(*
function Tld009f1.iScaleX(iConvert:integer):integer;
//ver 13 May 14, 16:18... see LT3Nf.htm, if you need to alter.
//This no longer has a role in the code, but remains because
//  reference is made to a "iScaleX" function in LT3N.htm, a
//  tutorial explaining the development of this application.
begin
  siTmp:=(iConvert-iScXOffset)*siScXStretch;
  iTmp:=trunc(siTmp);
  result:=iTmp;
end;//iScaleX
*)
//=========

//==============================
procedure Tld009f1.DrawXAxis;
//Could be made more clear? Use wGrGAHeight/wGrGAWidth,
//    or just work lineto in Bitmap units?
//Re-word DrawYAxis at same time
var bTmpL:byte;
begin
  for bTmpL:=0 to bGrAxWidX-1 do begin
  Image1.Picture.Bitmap.canvas.moveto
    (iGAtoBitmapX(-1),  iBitMapFrmHumY(-1-bTmpL));

  Image1.Picture.Bitmap.canvas.lineto
    (iImageWidth,       iBitMapFrmHumY(-1-bTmpL));
  end;//for
end; //DrawXAxis

procedure Tld009f1.DrawYAxis;
//Could be made more clear? Use wGrGAHeight/wGrGAWidth,
//    or just work lineto in Bitmap units?
//Re-word DrawXAxis at same time
var bTmpL:byte;
begin
  for bTmpL:=0 to bGrAxWidY-1 do begin
  Image1.Picture.Bitmap.canvas.moveto
    (iGAtoBitmapX(-1-bTmpL), iBitMapFrmHumY(-1)+bGrAxWidX-1);

  Image1.Picture.Bitmap.canvas.lineto
    (iGAtoBitmapX(-1-bTmpL),  -1);
  end; //for
end; //DrawYAxis

//=====================
procedure Tld009f1.MoveLineToAndInclude(iX1,iY1,iX2,iY2:integer);
//If you call lineto(0,0,3,3), only pixels 0,0/ 1,1/ and 2,2 are
//  affected. This procedure, when called with the same parameters
//  affects all of those pixels AND pixel 3,3.
begin
  Image1.Picture.Bitmap.canvas.moveto(iGAtoBitmapX(iX1),iBitMapFrmHumY(iY1));
  Image1.Picture.Bitmap.canvas.lineto(iGAtoBitmapX(iX2),iBitMapFrmHumY(iY2));
  Image1.Picture.Bitmap.canvas.pixels[iGAtoBitmapX(iX2),
                    iBitMapFrmHumY(iY2)]:=Image1.Picture.Bitmap.canvas.pen.color;
end; //MoveLineToAndInclude

procedure Tld009f1.buQuitClick(Sender: TObject);
begin
  close;
end;

procedure Tld009f1.buChangeDataClick(Sender: TObject);
begin
  showmessage('In due course, user will have chance here to say '+
     'what data set to switch to. At the moment, there is just '+
     'the one data set. Consider yourself "switched"... from "a" to "a"!');
  ChangeDataStep1;
  EstablishBitmap;//to clear previous data from graph
  //ChangeDataStep2; Is done inside EstablishBitmap;
  DrawGraph;
end;

function Tld009f1.iBitMapFrmHumY(iConvert:integer):integer;
//ver 13 May 14, 16:18... see LT3Nf.htm, if you need to alter.
//To be written out, replaced by iGAtoBitmapY. Make note in
//   LT3Nf at place where iBitMap... was developed when it is
//   written out.
begin
  //With iImageHeight=20, wGrMarBott=4, bGrAxWidY=1, the number that
  //  iConvert is taken away from should be 14.
  //The brackets aren't necessary for the mathematics, but are there
  //  to help you see the basic "trick" of inverting a series of
  //  numbers: take a varying but increasing "input" number away
  //  from a constant to obtain a varying but DEcreasing "output".
  result:=wGrGAHeight-iConvert;
end;

procedure Tld009f1.ChangeDataStep1;
//Establish which data stream is to be read, and "connect" it.
//Do an analysis of the data, determine max and min X and Y
//Eventually set up with a parameter to say "This data", or
//  "Ask user which data".
//Update on-screen display naming the data set we are using.

begin //ChangeDataStep1
  sDataSet:='SampleData';//This will eventually be changeable,
  //  and will tell you what company's prices you are looking
  //  at, and will be part of designating which data file to read.
  laDataSet.caption:=sDataSet;//Tell the user what data we are reading.

  //The application is set up to scan data files, which must be in
  //  chronological order, oldest first. The application will not
  //  always read ALL of the data available. It will only scan back
  //  as far as it has been told to by the value in wOldestToDisplay,
  //  which users will, one day, be able to change as they wish.

  wOldestToDisplay:=41729;

  // ... continue ChangeDataStep1...
  //"Connect" to data, and put pointer to "what record we want to read
  //    next to first record.
  wWhereInData:=1;
  //wWhereInData:=1; is all that's needed to "open the datastream" as
  //long as I am using the simple "data source" of the string sDataSource.
  //For now, we aren't using a data stream. We are hardcoding the data
  //So first two lines of comment in this block merely mark place of
  //    things to come
  //Put "prep to scan data" in a SR.

  //Close and re-open datastream between "Scan to find max/min" and "scan to plot"

  //Scan the data, determine max/min X and Y

  wXMinRaw:=65533;
  wXMaxRaw:=0;
  liYMinRaw:=99999;
  liYMaxRaw:=-5000000;

  ReadRecord(wDate,liPrice);
  //if invalid(ior wDate<wOldestToDisplay, report and abort rest. Else...
  begin// "1"
    repeat
      if wDate<wXMinRaw then wXMinRaw:=wDate;
      if wDate>wXMaxRaw then wXMaxRaw:=wDate;
      if liPrice<liYMinRaw then liYMinRaw:=liPrice;
      if liPrice>liYMaxRaw then liYMaxRaw:=liPrice;
      ReadRecord(wDate,liPrice);
    until {file is empty or} wDate<wOldestToDisplay;
  end;//begin "1"

  //Release connection to datastream will go here, when one needed
  //(Code WILL be needed... but not needed until
  //  using fancier data source than sDataSource
  end;//of ChangeDataStep1

//=====================
//Raw data to GraphArea coordinate conversion functions....

function Tld009f1.iRawToGAX(wConvert:word):integer;
//Believed completely "sound".
begin
  result:=trunc((wConvert-wScXOffset)*siScXStretch);
  end;

function Tld009f1.iRawToGAY(liConvert:longint):integer;
//This will do offset and scale but NOT the inversion which the
//  "upside down" Y axis of the bitmap demands. That's taken care
//  of withing iGAtoBitmap. The numbers from iRawToGAY run from
//  zero to wGrGAHeight (-1) (or not.. there may be a "off-by-one"
//  problem lurking here... change calc of scale factor, if so,
//  but as I plan some whitespace above and below, this "isn't"(?)
//  a major problem?
//NOTE: There are strange things going on, because of the inverted
//  scale... fiddle carefully, if you must do it at all!
begin
  result:=trunc((liConvert-liYMinRaw)*siScYStretch);//));//-liScYOffset*);
  end;

//================
function Tld009f1.iGAtoBitmapX(iConvert:integer):integer;
//GraphArea to Bitmap coordinate conversion (X)
begin
  result:=iConvert+wGrMarLeft+bGrAxWidY;
  end;

function Tld009f1.iGAtoBitmapY(iConvert:integer):integer;
//GraphArea to Bitmap coordinate conversion (Y)
//Remember: Bitmap "Y" coord has zero at TOP. The values
//  passed to this function will be "right", but, in bitmap
//  Y coords terms, "upside down".
//Happily, because, once in bitmap coords, we are working
//  from the top down, we don't have to worry about the
//  axis line and the bottom margin... they are "above" the
//  datapoints we want to put on bitmap.
begin
  result:=(wGrGAHeight-iConvert-1)-iGrBelowDataCloudGap;
  //The "-1" is a KLUDGE! Fixes "show the thing that should
  //  be at the bottom of the graph...
  //  But may push "thing that should be at top" over the edge,
  //    past the top of the Bitmap.
  //As I intend having some "white space" above and below
  //  the plotted data points, I can, though I shouldn't,
  //  live with this... IF it is happening. It may be
  //  that max values plot properly, i.e. in top row, too.
  //The MINUS iGrBelowDataCloudGap is to create the blank
  //  area below the data cloud. It has to be minus as the
  //  coordinates of the bitmap go up as you go down the screen.
  end;  //iGAtoBitmapY

//============
procedure Tld009f1.ReadRecord(var w1:word;var li1:longint);
//w1, li1 can have anything in them when the SR is called. Irrelevant.
//wWhereInData must have a correct value. Should be 1 when ReadRecord
//    first called
//Pick up two numbers from global constant sDataSource.
//(Using globals, the way wWhereInData and sDataSource are being used is
//    a Bad Idea... and I will probably be punished. We shall see.)
begin
  sTmp:='';
  while (sDataSource[wWhereInData] <>'-') and
     (sTmp<>'9999') do begin
     sTmp:=sTmp+sDataSource[wWhereInData];
     inc(wWhereInData);
     end;//"While..."
     inc(wWhereInData);
  w1:=strtoint(sTmp);

  if w1<>9999 then begin //Read li1
  sTmp:='';
  while sDataSource[wWhereInData]<>'/' do begin
     sTmp:=sTmp+sDataSource[wWhereInData];
     inc(wWhereInData);
     end;//"While..."
     inc(wWhereInData);
  li1:=strtoint(sTmp);

  end;//Read li1

  if w1=9999 then begin
       wWhereInData:=wWhereInData-5;
  end;

end;//ReadRecord

procedure Tld009f1.GreenLine(iX1,iY1,iX2,iY2:integer);
//Parameters expressed in the units used by the bitmap.
//Remember: Draws TO, but not including, iX2,iY2
begin
  Image1.Picture.Bitmap.canvas.pen.mode:=pmXor;
  Image1.Picture.Bitmap.canvas.pen.color:=(clGreen XOR clWhite);//changes
        //white to green and visa versa when line drawn, etc.

  Image1.Picture.Bitmap.canvas.moveto(iX1,iY1);
  Image1.Picture.Bitmap.canvas.lineto(iX2,iY2);

  Image1.Picture.Bitmap.canvas.pen.mode:=pmCopy;
end;// (draw...) GreenLine

procedure Tld009f1.BlueLine(wX:word);
//Set boDraw true to draw the line, false to erase it
//This can almost certainly be made to run more quickly
//  by pre-calculating elsewhere the Y values for the
//  ends of the blue line
var iLineBottBitmap, iLineTopBitmap:integer;//The Y coords, in
    //"bitmap" units, for top and bottom of the line.
begin
//Figure out where the bottom of the line will be
siTmp:=(wGrGAHeight*bLineBottPercent)/100;
iLineBottBitmap:=wGrGAHeight-trunc(siTmp);

//Figure out where the top of the line will be
siTmp:=(wGrGAHeight*(100-bLineTopPercent))/100;
iLineTopBitmap:=trunc(siTmp);

Image1.Picture.Bitmap.canvas.pen.mode:=pmXor;//pmCopy seems to be the default
Image1.Picture.Bitmap.canvas.pen.color:=(clBlue XOR clWhite);//changes
        //white to blue and visa versa when line drawn, etc.

Image1.Picture.Bitmap.canvas.moveto(iGAtoBitmapX(iRawToGAX(wX)),
                 iLineBottBitmap);
Image1.Picture.Bitmap.canvas.lineto(iGAtoBitmapX(iRawToGAX(wX)),
                 iLineTopBitmap);

Image1.Picture.Bitmap.canvas.pen.mode:=pmCopy;
end;// (draw...) BlueLine

procedure Tld009f1.LayDownGreenLine;
//This procedure puts a GreenLine on the bitmap for
//  the first time after bitmap wiped clear for new start
//  or after resize. (Etc?)
//Calls of LayDownGreenLine must be inserted in just
//  the right places, and only there.
//The first one was put near the end of DrawGraph,
//  which lays down the data points.
begin
iTmp:=sbUpperRight.position;
GreenLine(wGrMarLeft+bGrAxWidX+trunc(wGrGAWidth*10/100),
       20,wGrMarLeft+bGrAxWidX+trunc(wGrGAWidth*90/100),iTmp);
end;

function Tld009f1.bPosnAsPercentY(iTmpL:integer):byte;
begin
result:=trunc(iTmpL/wGrGAHeight)*100;
end;

procedure Tld009f1.ChangeDataStep2;
//Much (all?) of this is concerned with (re)calculating constants for
//  converting Raw data to GA data and GA to bitmap coordinates.

//Work out the scaling factors needed for plotting, using
//  the current display area information (from variables)
//  and the current data set's characteristics (max and
//  min X and Y.

//The idea of the offsets and streches are to map data from
//  ranges defined by the Min/Max variables filled in ChangeDataStep1
//  to ranges which suit our graphing needs better... from 0 to the
//  maximum X or Y coordinate, as expressed in pixels.
//If, on say the Y axis, our data went from 10 to 110, and we had
//  pixels 0 to 10 available to display that data, the offset would
//  be 10, to bring 10 to 110 down to 0 to 100, and the scale factor
//  would be 0.1 to bring the 0 to 100 down to 0 to 10.
//The first row (or colum) of pixels in the display area will be
//  row or column "=0", at least as far as the plotting routines are
//  concerened. It can STAND FOR anything, of course, standing for
//  10 in the example developed above.
var wFakeXMax:word;
    liFakeYMin,liFakeYMax:longint;//These variables are not
    //really necessary, but I hope they help make more clear the
    //logic of how the blank areas on the graph are created.
    bGrGapRight,bGrGapAbove,bGrGapBelow:byte;

begin  //ChangeDataStep2
  //Fill the relevant variables with the values which determine
  //  the size of the blank areas above, below, and to the
  //  right of the cloud of plotted data points.
  //These numbers are "percents", in other words, if
  //  bGrGapRight is set to 40, then the right hand 40% of
  //  the width of the GraphArea should be blank.
  bGrGapRight:=40;
  bGrGapAbove:=40;
  bGrGapBelow:=30;

//Deal with creating blank area to right of data cloud
//Everything relevant is here.
  siTmp:=(wXMaxRaw-wXMinRaw)/(100-bGrGapRight);
  iTmp:=trunc(siTmp*bGrGapRight);
  wFakeXMax:=wXMaxRaw+iTmp;

//...continue ChangeDataStep2...
//Deal with creating blank areas above and below data cloud.
//Most of what is relevant here, and a slight change
//  was also needed in iGAtoBitmapY. The "-iGrBelowDataCloudGap"
//  term is about creating the bottom gap.

  liTmp:=liYMaxRaw-liYMinRaw;
  siTmp:=liTmp/(100-bGrGapAbove-bGrGapBelow);
  liTmp:=trunc(siTmp*bGrGapAbove);
  liTmp2:=trunc(siTmp*bGrGapBelow);

  liFakeYMax:=liYMaxRaw+liTmp;
  liFakeYMin:=liYMinRaw-liTmp2;
  liGrGAMin:=liFakeYMin;//Need elsewhere (DrawBlue, for instance)

  wScXOffset:=wXMinRaw;
  liScYOffset:=liFakeYMax;

  siScXStretch:=wGrGAWidth/(wFakeXMax-wXMinRaw+1);//The "+1" is a KLUDGE...
  //with it, the range isn't stretched TOO far. (Without it, the last
  //data point is off the edge (or top... bottom(?) of page.)

  siScYStretch:=wGrGAHeight/(liFakeYMax+1-liFakeYMin);//The "+1" is a KLUDGE.

  siTmp:=(wGrGAHeight*bGrGapBelow)/100;
  iGrBelowDataCloudGap:=trunc(siTmp);

end; //ChangeDataStep2

procedure Tld009f1.sbUpperRightScroll(Sender: TObject; ScrollCode: TScrollCode;
  var ScrollPos: Integer);
//(Upper_Right was first one I did. Took forever, c. 18May14)
//You must ensure that the line has been drawn ONCE before this is called
//   for the first time.
//iPrevX[n] and iPrevY[n] tell you where the line lies, as you enter this
//   "redraw-line-in-new-posn routine. You need to know, so you can, as
//   part of this, erase old line first, using the wonders of page mode pmXOR.
//You must not call Greenline elsewhere, unless you call it exactly a
//  multiple of two times, duplicating the erase/redraw sequence of the
//  following, and keeping iPrevY up to date.

var wTmpXL,wTmpYL:word;

begin  //sbUpperRightScroll
  wTmpYL:=ScrollPos;//Same... I think!... as sbUpperRight.position, but, within
     //this subroutine, more accessible, I hope.
     //Make note for erase-in-future of where new line was
  label1.caption:=inttostr(wTmpYL);

  //Overdraw old line, erasing it, in prep for draw new line...
  //(It may be worth, for speed's sake, eventually redoing as...
  //   GreenLine(0,10,60,150,iPrevY[1]);, skipping the
  //         FillCoords/ 2x access to iGreenLineEnds(record)
  //But wait to see final form with all coords flexible before
  //   doing that.

  FillCoords(0,wGrMarLeft+bGrAxWidX+trunc(wGrGAWidth*10/100),
     iPrevY[0],wGrMarLeft+bGrAxWidX+trunc(wGrGAWidth*90/100),iPrevY[1]);
                                            //sbUpperRightScroll continued....

  //Overdraw old, erasing it...
      GreenLine(
         iGreenLineEnds[0].x1,iPrevY[0],
         iGreenLineEnds[0].x2,iPrevY[1]);

  //Draw new...
      GreenLine(
         iGreenLineEnds[0].x1,iPrevY[0],
         iGreenLineEnds[0].x2,wTmpYL);

  //Record where end of new was, for next erase...
      iPrevY[1]:=wTmpYL;

end;//sbUpperRightScroll

procedure Tld009f1.sbUpperLeftScroll(Sender: TObject; ScrollCode: TScrollCode;
  var ScrollPos: Integer);
//See notes at Upper_Right... works in similar way.

var wTmpXL,wTmpYL:word;

begin  //sbUpperLeftScroll
  wTmpYL:=ScrollPos;
     //Make note for erase-in-future of where new line was
  label1.caption:=inttostr(wTmpYL);

  //Overdraw old line, erasing it, in prep for draw new line...
  //(It may be worth, for speed's sake, eventually redoing as...
  //   GreenLine(0,10,60,150,iPrevY[1]);, skipping the
  //         FillCoords/ 2x access to iGreenLineEnds(record)
  //But wait to see final form with all coords flexible before
  //   doing that.

  FillCoords(0,wGrMarLeft+bGrAxWidX+trunc(wGrGAWidth*10/100),
     iPrevY[0],wGrMarLeft+bGrAxWidX+trunc(wGrGAWidth*90/100),iPrevY[1]);
                                            //sbUpperLeftScroll continued....

  //Overdraw old, erasing it...
      GreenLine(
         iGreenLineEnds[0].x1,iPrevY[0],
         iGreenLineEnds[0].x2,iPrevY[1]);

  //Draw new...
      GreenLine(
         iGreenLineEnds[0].x1,wTmpYL,
         iGreenLineEnds[0].x2,iPrevY[1]);

  //Record where end of new was, for next erase...
      iPrevY[0]:=wTmpYL;

end;//sbUpperLeftScroll

procedure Tld009f1.sbLowerRightScroll(Sender: TObject; ScrollCode: TScrollCode;
  var ScrollPos: Integer);
//See notes at Upper_Right... works in similar way.

var wTmpXL,wTmpYL:word;

begin  //sbLowerRightScroll
  wTmpYL:=ScrollPos;
     //Make note for erase-in-future of where new line was
  label1.caption:=inttostr(wTmpYL);

  //Overdraw old line, erasing it, in prep for draw new line...
  //(It may be worth, for speed's sake, eventually redoing as...
  //   GreenLine(0,10,60,150,iPrevY[1]);, skipping the
  //         FillCoords/ 2x access to iGreenLineEnds(record)
  //But wait to see final form with all coords flexible before
  //   doing that.

  FillCoords(1,wGrMarLeft+bGrAxWidX+trunc(wGrGAWidth*10/100),
     iPrevY[2],wGrMarLeft+bGrAxWidX+trunc(wGrGAWidth*90/100),iPrevY[3]);
                                            //sbLowerRightScroll continued....

  //Overdraw old, erasing it...
      GreenLine(
         iGreenLineEnds[1].x1,iPrevY[2],
         iGreenLineEnds[1].x2,iPrevY[3]);

  //Draw new...
      GreenLine(
         iGreenLineEnds[1].x1,iPrevY[2],
         iGreenLineEnds[1].x2,wTmpYL);

  //Record where end of new was, for next erase...
      iPrevY[3]:=wTmpYL;

end;//sbLowerRightScroll


procedure Tld009f1.sbLowerLeftScroll(Sender: TObject; ScrollCode: TScrollCode;
  var ScrollPos: Integer);
//See notes at Upper_Right... works in similar way.

var wTmpXL,wTmpYL:word;

begin  //sbLowerLeftScroll
  wTmpYL:=ScrollPos;
     //Make note for erase-in-future of where new line was
  label1.caption:=inttostr(wTmpYL);

  //Overdraw old line, erasing it, in prep for draw new line...
  //(It may be worth, for speed's sake, eventually redoing as...
  //   GreenLine(0,10,60,150,iPrevY[1]);, skipping the
  //         FillCoords/ 2x access to iGreenLineEnds(record)
  //But wait to see final form with all coords flexible before
  //   doing that.

  FillCoords(1,wGrMarLeft+bGrAxWidX+trunc(wGrGAWidth*10/100),
     iPrevY[2],wGrMarLeft+bGrAxWidX+trunc(wGrGAWidth*90/100),iPrevY[3]);
                                            //sbLowerLeftScroll continued....

  //Overdraw old, erasing it...
      GreenLine(
         iGreenLineEnds[1].x1,iPrevY[2],
         iGreenLineEnds[1].x2,iPrevY[3]);

  //Draw new...
      GreenLine(
         iGreenLineEnds[1].x1,wTmpYL,
         iGreenLineEnds[1].x2,iPrevY[3]);

  //Record where end of new was, for next erase...
      iPrevY[2]:=wTmpYL;

end;//sbLowerLeftScroll

end.
That's the end the "major start" we've made. In the next (and final!) web page in this series, we will add ini files, save whre we've placed the green lines, start dealing with more than one stock. Oh, the fun we have ahead!
Onward to the "home stretch"... in LT3Nf-3.htm, the last part of this major tutorial
Search across all my sites with the Google search...

|
|
![]() Page tested for compliance with INDUSTRY (not MS-only) standards, using the free, publicly accessible validator at validator.w3.org. Mostly passes. There were two "unknown attributes" in Google+ button code. Sigh.
Page tested for compliance with INDUSTRY (not MS-only) standards, using the free, publicly accessible validator at validator.w3.org. Mostly passes. There were two "unknown attributes" in Google+ button code. Sigh.
....... P a g e . . . E n d s .....